Question
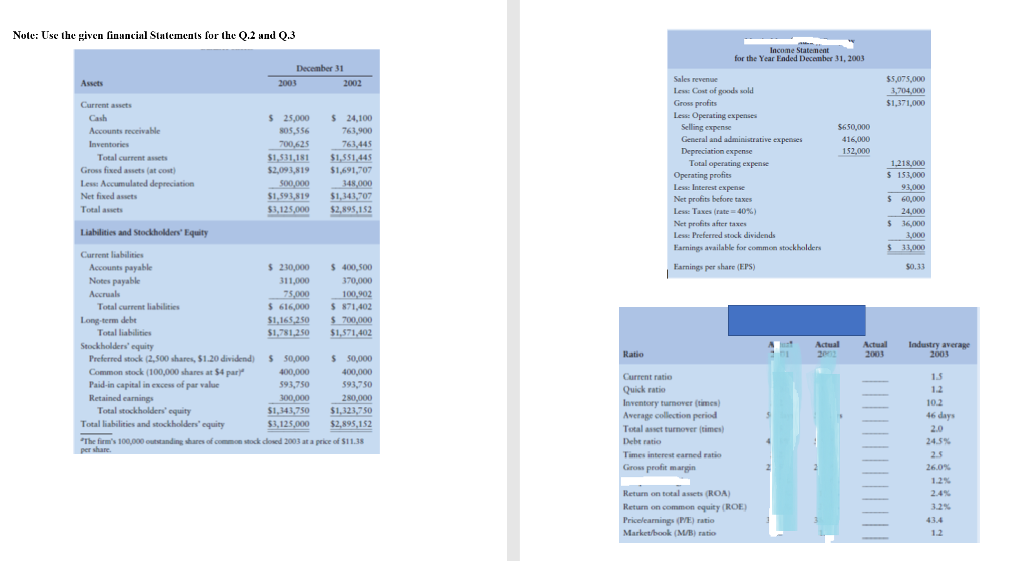
Business Finance Questions: Q.2 a. Calculate the firms 2003 financial ratios given in the table above. (15) b. Analyze the firms current financial position from
Business Finance Questions:

Q.2 a. Calculate the firms 2003 financial ratios given in the table above. (15)
b. Analyze the firms current financial position from industry Break your analysis into evaluations of the firms liquidity, activity, debt, profitability, and market.
c. Summarize the firms overall financial position on the basis of your findings in part b.
Q.3 The CEO would like to see higher sales and a forecasted net income of $50,000. Assume that operating costs (excluding depreciation and amortization) are 55 percent of sales, and depreciation and amortization and interest expenses will increase by 10 percent. The tax rate, which is 40 percent, will remain the same. What level of sales would generate $2,500,000 in net income?
Note: Use the given financial Statements for the Q.2 and Q.3 Income Statement for the Year Ended December 31, 2003 December 31 2003 2002 Assets $5,075,000 3,704,000 $1,371,000 $650,000 416,000 152,000 Current assets Cash Accounts receivable Inventories Total current Gross fixed assets at cost) Lew: Accumulated depreciation Net fixed assets Total acts $ 25,000 805,556 700.625 $1,531,181 $2,093,815 500,000 $1,593,819 $3,125,000 $ 24,100 763,900 763,445 $1,551,449 $1,691,707 348,000 $1,341,707 $2,895,152 Sales revenue Low Cost of goods sold Gross profits Less Operating expenses Selling expense General and administrative expenses Depreciation expense Total operating expense Operating profits Les Interest expense Net profits before taxes Less Taxes (rate 40%) Net profits after taxes Less Preferred stock dividends Farnings available for common stockholders 1,218,000 $ 153,000 93,000 $ 60,000 24,000 $ 16,000 3,000 $ 31,000 $0.13 Earnings per share (EPS) Liabilities and Stockholders' Equity Current liabilities Accounts payable $ 210,000 $ 400,500 Notes payable 311,000 370,000 Accruals 75,000 100,902 Total current liabilities $ 616,000 $ 871,402 Long-term debe $1,165,250 $ 700,000 Total liabilities $1,781,250 $1,571,402 Stockholders' equity Preferred stock (2,500 shares, $1.20 dividend) $50,000 $ 50,000 Common stock (100,000 shares at S4par" 400,000 400,000 Paid-in capital in excess of par value 593,750 593,750 Retained earnings 300,000 280,000 Total stockholders' equity $1,343,750 $ $1,323,750 Total liabilities and stockholders' equity $3,125,000 $2,895,152 "The firm's 100,000 outstanding shares of common stock closed 2003 at a price of $11.38 per share Actual 2013 Actual 2003 Ratio Industry average 2003 Current ratio Quick ratio Inventory turnover times) Average collection period Total asset turnover times) Debt ratio Times interest earned ratio Gross profit margin 15 1.2 10.2 46 days 2.0 24.5% 25 26.0 1.2% 2.4% 3.2% 2 Return on total assets (ROA) Return on common equity (ROE) Pricelearnings (PE) ratio Market book (M/B) ratio 1.2Step by Step Solution
There are 3 Steps involved in it
Step: 1

Get Instant Access to Expert-Tailored Solutions
See step-by-step solutions with expert insights and AI powered tools for academic success
Step: 2

Step: 3

Ace Your Homework with AI
Get the answers you need in no time with our AI-driven, step-by-step assistance
Get Started


