BUSINESS FORECASTING QUESTION. PLEASE ANSWER QUESTION WITH R PROGRAMMING IF POSSIBLE Note: I cannot upload the full data as it has 2000+ rows but learning
BUSINESS FORECASTING QUESTION. PLEASE ANSWER QUESTION WITH R PROGRAMMING IF POSSIBLE
Note: I cannot upload the full data as it has 2000+ rows but learning how to answer the problems is what I need. This question is a question that I will use only for reviewing
CASE: You are a business consultant helping clients with your analytical solutions. Your client is a telecommunications company and needs forecasts on the percentage of bad mobile calls to be able to decide whether or not to partner with an infrastructure rm for development purposes.
The client provides you with the dataset that has Bad Calls (as percentage of total calls), Pressure (air pressure) and Wind Speed hourly data. Show that a nontechnical executive summary to your client recommending whether or not to get into the partnership. The report should include the following for the variable Bad Calls:
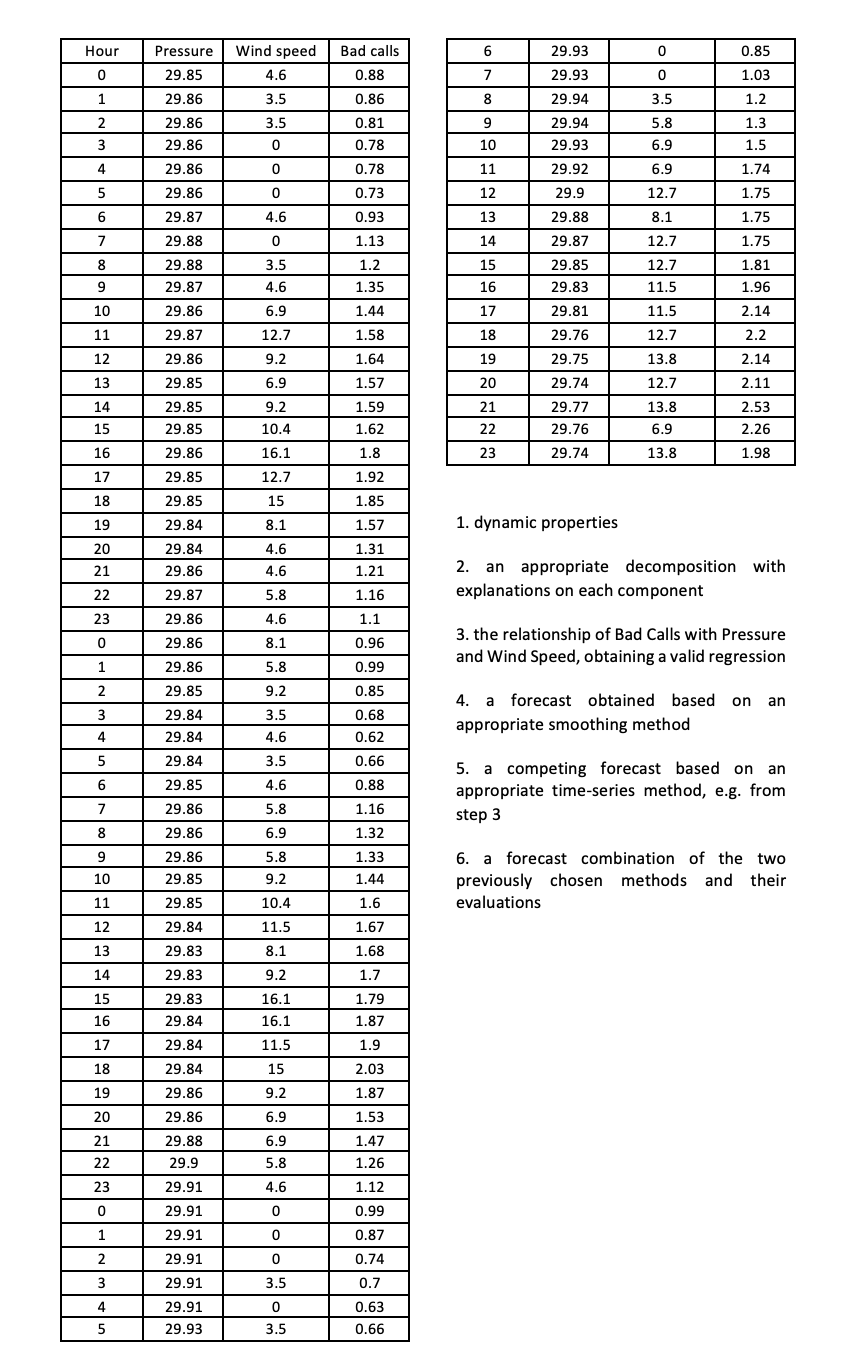
Hour Pressure Wind speed 6 0 0.85 Bad calls 0.88 0 29.85 4.6 7 29.93 29.93 29.94 0 1.03 1.2 1 29.86 3.5 0.86 8 2 3.5 9 29.86 29.86 0.81 0.78 29.94 29.93 3.5 5.8 6.9 6.9 0 10 3 4 1.3 1.5 1.74 1.75 29.86 0.78 29.92 0 0 11 12 0.73 12.7 5 6 29.86 29.87 29.88 4.6 0.93 13 29.9 29.88 29.87 8.1 1.75 1.75 7 0 1.13 12.7 14 15 3.5 29.88 29.87 1.2 1.35 12.7 11.5 1.81 1.96 4.6 29.85 29.83 29.81 16 8 9 10 11 12 17 11.5 2.14 6.9 12.7 1.44 1.58 18 29.76 12.7 2.2 2.14 9.2 19 29.75 13.8 1.64 1.57 13 6.9 20 12.7 2.11 14 1.59 21 13.8 9.2 10.4 29.74 29.77 29.76 29.74 2.53 2.26 15 1.62 22 29.86 29.87 29.86 29.85 29.85 29.85 29.86 29.85 29.85 29.84 29.84 29.86 6.9 16.1 1.8 23 13.8 1.98 16 17 12.7 1.92 18 15 1.85 8.1 1.57 1. dynamic properties 19 20 21 4.6 4.6 1.31 1.21 1.16 2. an appropriate decomposition with explanations on each component 22 29.87 5.8 23 29.86 4.6 1.1 0 8.1 0.96 3. the relationship of Bad Calls with Pressure and Wind Speed, obtaining a valid regression 1 5.8 0.99 0.85 2 9.2 3.5 3 4 4. a forecast obtained based on an appropriate smoothing method 4.6 29.86 29.86 29.85 29.84 29.84 29.84 29.85 29.86 29.86 29.86 29.85 0.68 0.62 0.66 5 3.5 6 4.6 0.88 a competing forecast based on an appropriate time-series method, e.g. from step 3 7 5.8 1.16 8 6.9 1.32 5.8 9 9 10 1.33 1.44 9.2 6. a forecast combination of the two previously chosen methods and their evaluations 11 29.85 10.4 1.6 12 29.84 11.5 1.67 13 1.68 8.1 9.2 14 1.7 15 29.83 29.83 29.83 29.84 29.84 16.1 16.1 16 1.79 1.87 1.9 11.5 17 18 15 2.03 29.84 29.86 19 9.2 1.87 20 29.86 6.9 1.53 6.9 21 22 29.88 29.9 1.47 1.26 5.8 4.6 23 29.91 1.12 0.99 0 29.91 0 1 29.91 0 0.87 2 29.91 0 0.74 3 3.5 4 29.91 29.91 29.93 0 3.5 0.7 0.63 0.66 5 Hour Pressure Wind speed 6 0 0.85 Bad calls 0.88 0 29.85 4.6 7 29.93 29.93 29.94 0 1.03 1.2 1 29.86 3.5 0.86 8 2 3.5 9 29.86 29.86 0.81 0.78 29.94 29.93 3.5 5.8 6.9 6.9 0 10 3 4 1.3 1.5 1.74 1.75 29.86 0.78 29.92 0 0 11 12 0.73 12.7 5 6 29.86 29.87 29.88 4.6 0.93 13 29.9 29.88 29.87 8.1 1.75 1.75 7 0 1.13 12.7 14 15 3.5 29.88 29.87 1.2 1.35 12.7 11.5 1.81 1.96 4.6 29.85 29.83 29.81 16 8 9 10 11 12 17 11.5 2.14 6.9 12.7 1.44 1.58 18 29.76 12.7 2.2 2.14 9.2 19 29.75 13.8 1.64 1.57 13 6.9 20 12.7 2.11 14 1.59 21 13.8 9.2 10.4 29.74 29.77 29.76 29.74 2.53 2.26 15 1.62 22 29.86 29.87 29.86 29.85 29.85 29.85 29.86 29.85 29.85 29.84 29.84 29.86 6.9 16.1 1.8 23 13.8 1.98 16 17 12.7 1.92 18 15 1.85 8.1 1.57 1. dynamic properties 19 20 21 4.6 4.6 1.31 1.21 1.16 2. an appropriate decomposition with explanations on each component 22 29.87 5.8 23 29.86 4.6 1.1 0 8.1 0.96 3. the relationship of Bad Calls with Pressure and Wind Speed, obtaining a valid regression 1 5.8 0.99 0.85 2 9.2 3.5 3 4 4. a forecast obtained based on an appropriate smoothing method 4.6 29.86 29.86 29.85 29.84 29.84 29.84 29.85 29.86 29.86 29.86 29.85 0.68 0.62 0.66 5 3.5 6 4.6 0.88 a competing forecast based on an appropriate time-series method, e.g. from step 3 7 5.8 1.16 8 6.9 1.32 5.8 9 9 10 1.33 1.44 9.2 6. a forecast combination of the two previously chosen methods and their evaluations 11 29.85 10.4 1.6 12 29.84 11.5 1.67 13 1.68 8.1 9.2 14 1.7 15 29.83 29.83 29.83 29.84 29.84 16.1 16.1 16 1.79 1.87 1.9 11.5 17 18 15 2.03 29.84 29.86 19 9.2 1.87 20 29.86 6.9 1.53 6.9 21 22 29.88 29.9 1.47 1.26 5.8 4.6 23 29.91 1.12 0.99 0 29.91 0 1 29.91 0 0.87 2 29.91 0 0.74 3 3.5 4 29.91 29.91 29.93 0 3.5 0.7 0.63 0.66 5