Question
BUSINESS INTELLIGENCE -ITM 310 Please help me answer all of the parts. Instructions: 1) As you solve each problem, read it carefully. What question needs
BUSINESS INTELLIGENCE -ITM 310
Please help me answer all of the parts.
Instructions:
1) As you solve each problem, read it carefully. What question needs to be answered? What components (fields, filters, sort, etc.) will help solve the problem. How should your data be presented so the results seem logical from a business perspective?
2) If the problem calls for a chart, start with your pivot table and create the chart from it. Edit your chart for clarity and to reduce clutter. Copy and paste your chart either below or next to the pivot table for the problem.
3) When you build your pivot table, start with the measure(s) that you will be summarizing in the Values section. Then, add dimensions to the Row Labels and Column Labels. Copy and paste your pivot table in the space below the problem.
4) Be sure to set the number format(s) correctly. Currency must be formatted as such, with either 2 decimal places or none (for very large numbers)
Note: if your table output is really long (>12 lines), there is a problem in your setup
Northwind Trading Sales
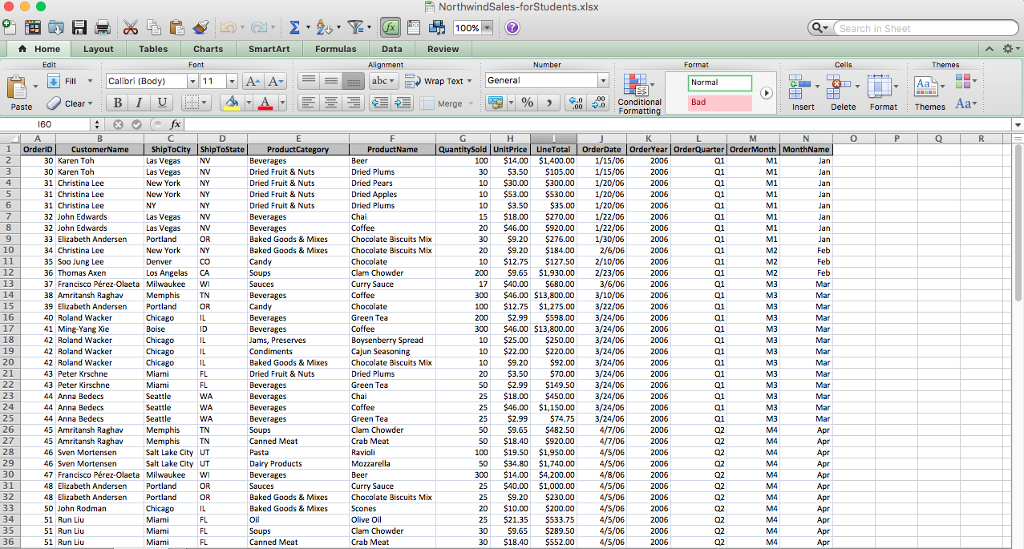
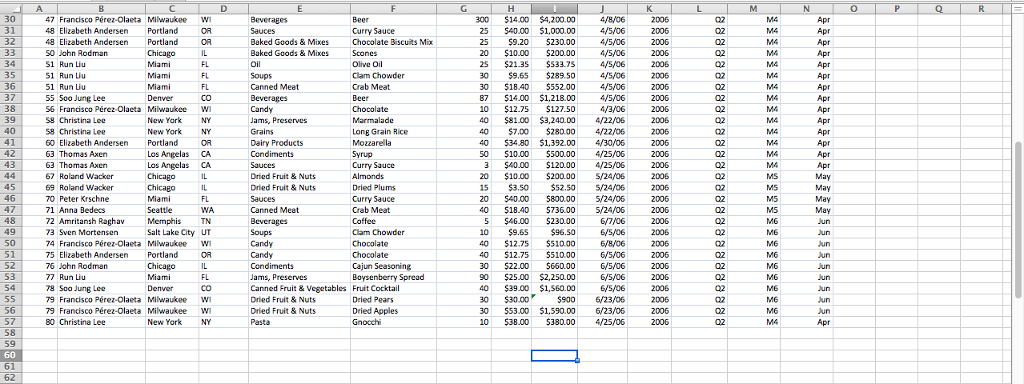
This analysis will use the NorthwindSales-forStudents.xlsx Excel workbook. The Sales Data worksheet contains your source data in the form of a standard Excel data set. Each row is a record of the sale of a product to one of Northwinds customers. Product attributes include the product name and a category name for groups of products. Customer attributes include the customers name, city and state. We have also included an order date attribute with year, month and quarter dimensions. The measures are quantity sold and line total (price times quantity sold).
Problem 1 Analyze Data (5 points)
Use data filters identify (but not fix) any data errors. Describe any issues you found >
Examine the data and answer the following questions:
What is the name of the column in which dollar amount of each sale is stored, and how is this calculated? >
What columns contain time data, and what are the possible values present in each column? >
Which of these columns identifies the calendar name of the months? >
Problem 2 Sales of sauces and soups by month (10 points)
Create a pivot table that summarizes sales (identified in 1.B.a above) for sauces and soups by the calendar month (identified in 1.B.c above) when they were ordered. Then, convert that pivot table to a chart. Copy and paste both the pivot table and chart in the space below. Adjust size and format as needed. Then, write a 1-2 sentence summary of any trends or data features you observe.
Problem 3 Beverage sales (10 points)
Create a chart that clearly shows the proportion of total beverage sales that each beverage product contributes. Copy and paste your solution in the space below. Adjust size and format as needed. Then, write a 1-2 sentence summary of the primary story that this chart tells.


There is no way to share a downloadble file in chegg.
NorthwindSales-forStudents.xlsx Search in Sheet | * Home L Layout | Tables Charts SmartArt | Formulas Data . Review nsert Delete FormatThemes Aa ProductName Dried Fruit & Nuts Dried Fruit& Nuts Baked Goods & Mixes Baked Goods& Mixes Chocolate Biscuits Mix Chocolate Biscuits Mx Thomas Axen Green Tea Boysenberry Spread Chocolate Biscuits M Baked Goods & Mixes Dried Fruit & Nuts Clam Chowder Curry Sauce Chocolate Biscuits Mix Canned Meat an an an an an an an an Feb Feb Feb Mar Mar Mar Mar Mar Mar Mar Mar Mar Mar Mar Mar Mar Apr Apr Apr Apr Apr Apr Apr Apr Apr Apr Apr 006 006 006 006 006 006 006 006 006 006 006 006 006 006 006 006 006 006 006 006 006 006 006 006 006 006 006 006 006 ona 34 88 00 00 88 00 00 00 50 00 00 00 00 .00 .00 00 00 50 00 75 50 .00 00 00 .00 75 50 .00 .50 80 .00 sid 100 30 10 10 10 15 20 30 20 10 200 17 300 100 200 300 10 10 20 SO 25 25 25 50 SO 100 300 25 25 20 25 30 30 ing NV NV NY NY NY NV NV OR NY CA WI TN R IL ID IL IL IL FL FL WA WA WA TN TN UT WI OR OR IL FL FL FL o ND o 3 3 1 1 2 2 3 4 6 7 8 9 4 4 4 4 4 4 4 4 44 44 4 4 4 4 4 880555 1 234567891 12 13 14 15 16 17 19 20 21 22 23 24 25 26 27 28 29 333 33 333 NorthwindSales-forStudents.xlsx Search in Sheet | * Home L Layout | Tables Charts SmartArt | Formulas Data . Review nsert Delete FormatThemes Aa ProductName Dried Fruit & Nuts Dried Fruit& Nuts Baked Goods & Mixes Baked Goods& Mixes Chocolate Biscuits Mix Chocolate Biscuits Mx Thomas Axen Green Tea Boysenberry Spread Chocolate Biscuits M Baked Goods & Mixes Dried Fruit & Nuts Clam Chowder Curry Sauce Chocolate Biscuits Mix Canned Meat an an an an an an an an Feb Feb Feb Mar Mar Mar Mar Mar Mar Mar Mar Mar Mar Mar Mar Mar Apr Apr Apr Apr Apr Apr Apr Apr Apr Apr Apr 006 006 006 006 006 006 006 006 006 006 006 006 006 006 006 006 006 006 006 006 006 006 006 006 006 006 006 006 006 ona 34 88 00 00 88 00 00 00 50 00 00 00 00 .00 .00 00 00 50 00 75 50 .00 00 00 .00 75 50 .00 .50 80 .00 sid 100 30 10 10 10 15 20 30 20 10 200 17 300 100 200 300 10 10 20 SO 25 25 25 50 SO 100 300 25 25 20 25 30 30 ing NV NV NY NY NY NV NV OR NY CA WI TN R IL ID IL IL IL FL FL WA WA WA TN TN UT WI OR OR IL FL FL FL o ND o 3 3 1 1 2 2 3 4 6 7 8 9 4 4 4 4 4 4 4 4 44 44 4 4 4 4 4 880555 1 234567891 12 13 14 15 16 17 19 20 21 22 23 24 25 26 27 28 29 333 33 333Step by Step Solution
There are 3 Steps involved in it
Step: 1

Get Instant Access to Expert-Tailored Solutions
See step-by-step solutions with expert insights and AI powered tools for academic success
Step: 2

Step: 3

Ace Your Homework with AI
Get the answers you need in no time with our AI-driven, step-by-step assistance
Get Started


