Answered step by step
Verified Expert Solution
Question
1 Approved Answer
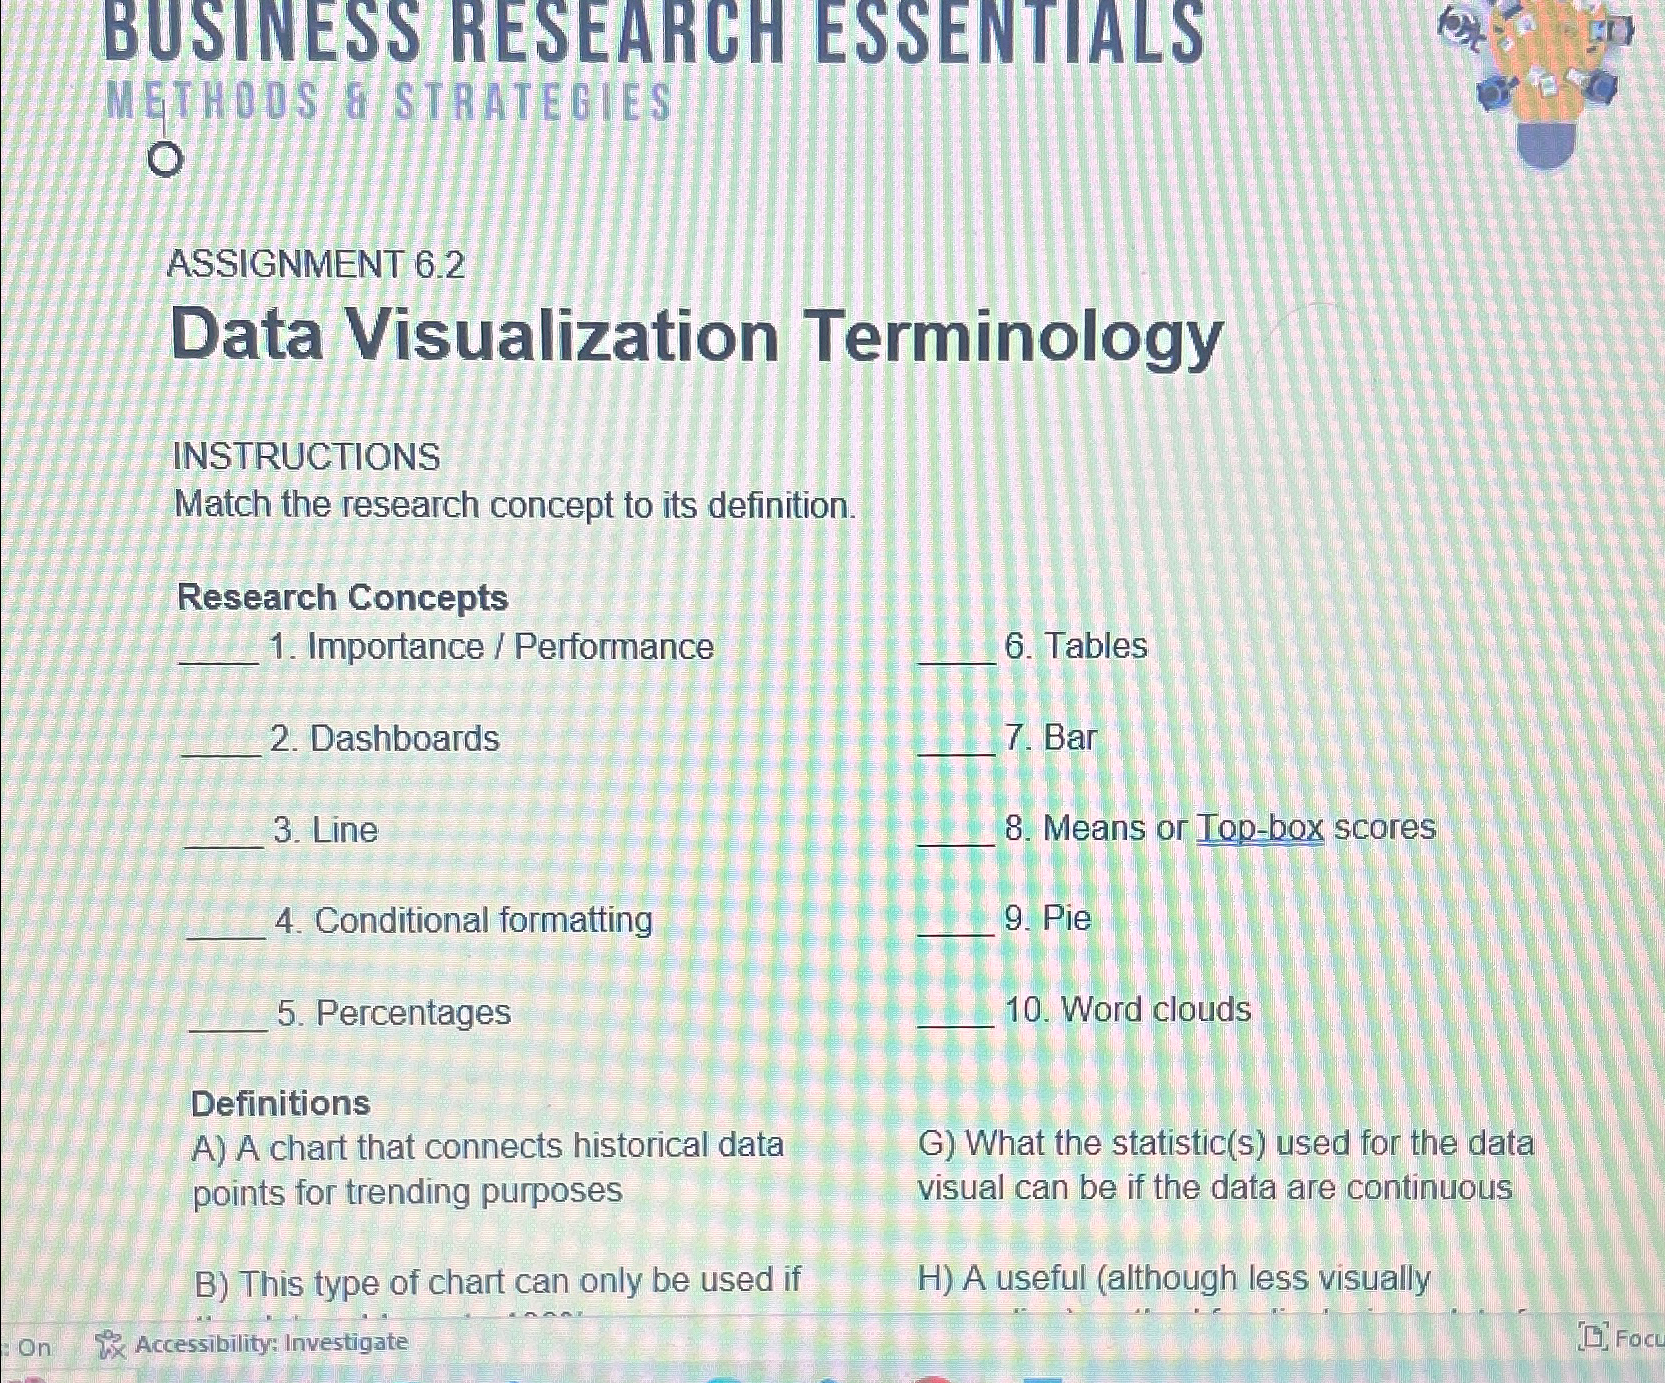
BUSINESS RESEARCH ESSENTIALS METHODS & STRATEGIES O ASSIGNMENT 6 . 2 Data Visualization Terminology INSTRUCTIONS Match the research concept to its definition. Research Concepts q
BUSINESS RESEARCH ESSENTIALS
METHODS & STRATEGIES
O
ASSIGNMENT
Data Visualization Terminology
INSTRUCTIONS
Match the research concept to its definition.
Research Concepts
Importance Performance Tables
Dashboards Bar
Line Means or Topbox scores
Conditional formatting Pie
Percentages Word clouds
Definitions
A A chart that connects historical data points for trending purposes
G What the statistics used for the data visual can be if the data are continuous
B This type of chart can only be used if
H A useful although less visually
On
Accessibility: Investigate

Step by Step Solution
There are 3 Steps involved in it
Step: 1

Get Instant Access to Expert-Tailored Solutions
See step-by-step solutions with expert insights and AI powered tools for academic success
Step: 2

Step: 3

Ace Your Homework with AI
Get the answers you need in no time with our AI-driven, step-by-step assistance
Get Started


