Answered step by step
Verified Expert Solution
Link Copied!

Question

1 Approved Answer

Business statistics question Select one: (N The trend value of Transport CO2 Emissions is equal to 22.32 megatonnes. (W In 200801 the predicted value of

Business statistics question
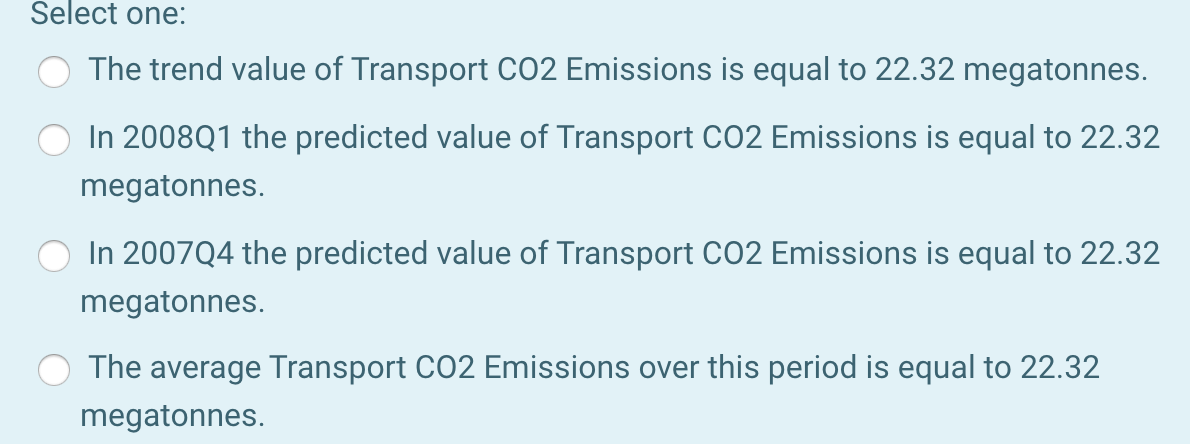
image text in transcribedimage text in transcribed
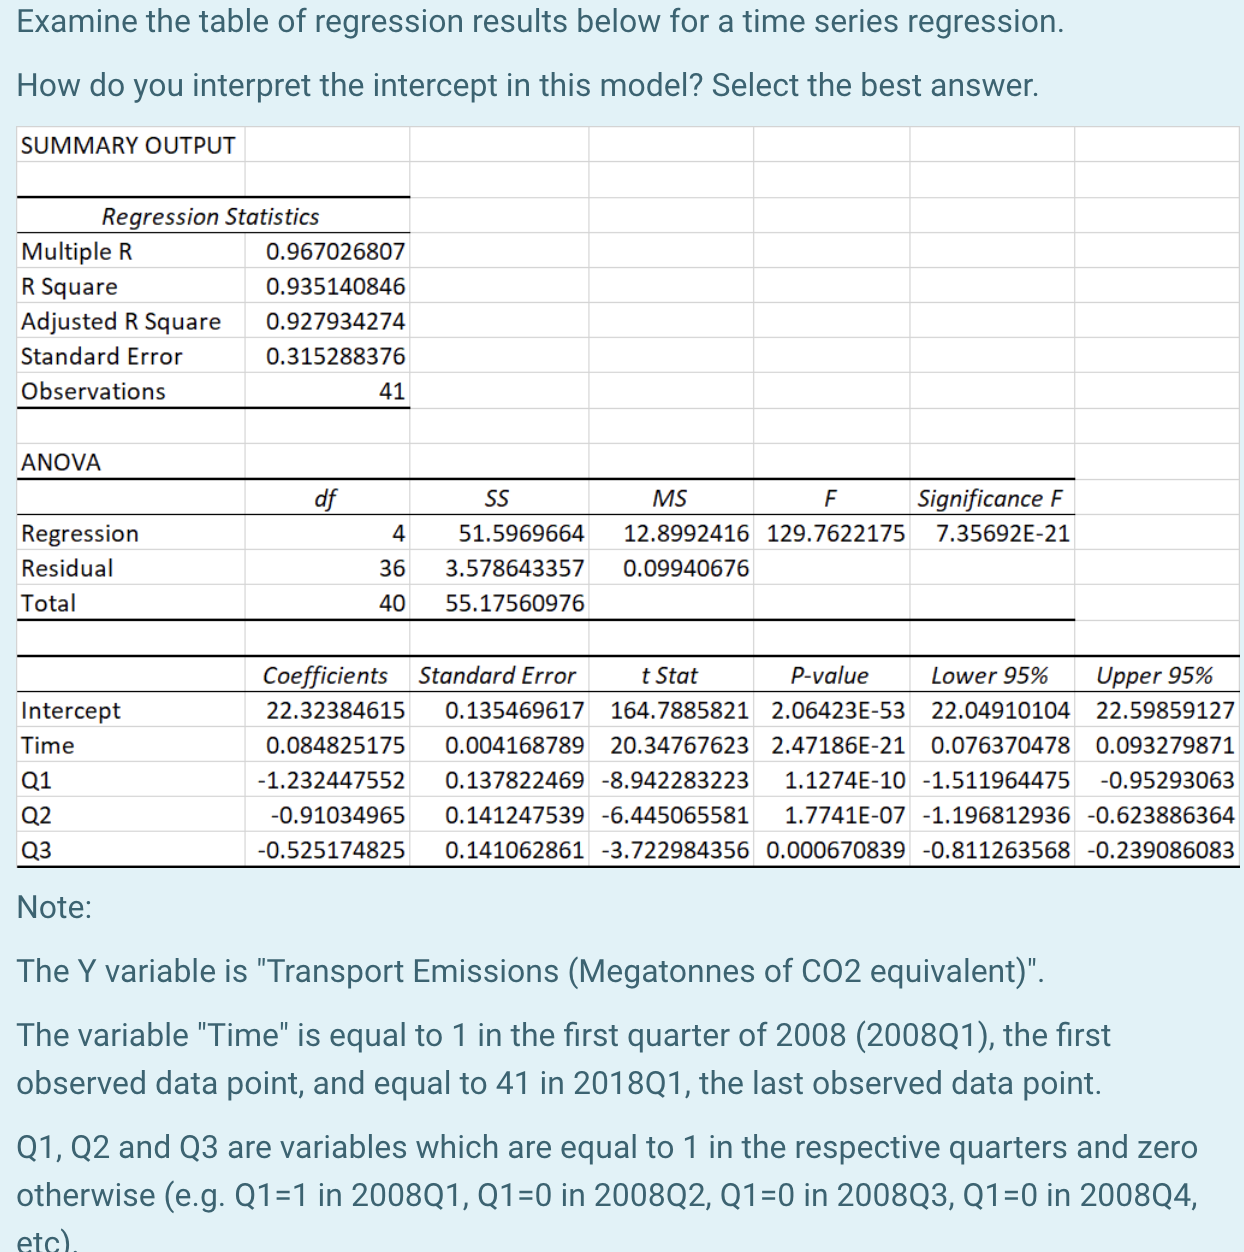
Select one: (\"N The trend value of Transport CO2 Emissions is equal to 22.32 megatonnes. (\"W In 200801 the predicted value of Transport CO2 Emissions is equal to 22.32 megatonnes. (\"W In 200704 the predicted value of Transport CO2 Emissions is equal to 22.32 megatonnes. (\"W The average Transport CO2 Emissions over this period is equal to 22.32 megatonnes. Examine the table of regression results below for a time series regression. How do you interpret the intercept in this model? Select the best answer. SU M MARY OUTPUT Regression Statistics Multiple R 0367026807 R Square 0.935140846 Adjusted R Square 0.927934274 Standard Error 0.315288376 Observations 41 ANOVA df 55 MS F Significance F Regression 4 51.5969664 12.8992416 129.7622175 7.35692E-21 Residual 36 3578643357 009940676 Total 40 5517560976 Coefficients Standard Error t Stat Pvaiue Lower 95% Upper 95% Intercept 22.32384615 0.135469617 164.7885821 2.06423E-53 22.04910104 22.59859127 Time 0.084825175 0.004168789 2034767623 2.47186E-21 0.076370478 0.093279871 Q1 -1.232447552 0.137822469 -8.942283223 1.1274E-10 -1.511964475 -0.95293063 C12 -0.91034965 0.141247539 -6.445065581 1.7741E-07 -1.196812936 0623886364 Q3 -0.525174825 0.141062861 3722984356 0.000670839 -0.811263568 0239086083 Note: The Y variable is "Transport Emissions (Megatonnes of 002 equivalent)". The variable "Time" is equal to 1 in the rst quarter of 2008 (200801), the rst observed data point, and equal to 41 in 201801, the last observed data point. 01, 02 and 03 are variables which are equal to 1 in the respective quarters and zero otherwise (e.g. Q1 =1 in 200801, 01 =0 in 200802, 01 =0 in 200803, 01 =0 in 200804, etc}

Step by Step Solution

There are 3 Steps involved in it

Step: 1

blur-text-image

Get Instant Access to Expert-Tailored Solutions

See step-by-step solutions with expert insights and AI powered tools for academic success

Step: 2

blur-text-image

Step: 3

blur-text-image

Ace Your Homework with AI

Get the answers you need in no time with our AI-driven, step-by-step assistance

Get Started

Recommended Textbook for

Quantitative Analysis For Management

Authors: Barry Render, Ralph M. Stair, Michael E. Hanna

11th Edition

9780132997621, 132149117, 132997622, 978-0132149112

Students also viewed these Mathematics questions

Question

1.LO27-3 List five important sources of growth.

Answered: 1 week ago