Answered step by step
Verified Expert Solution
Question
1 Approved Answer
Business Statistics The Dow Jones Industrial Average (DJA) and the Standard & Poor's 500 (S&P 500) indexes are used as measures of overall movement in
Business Statistics 
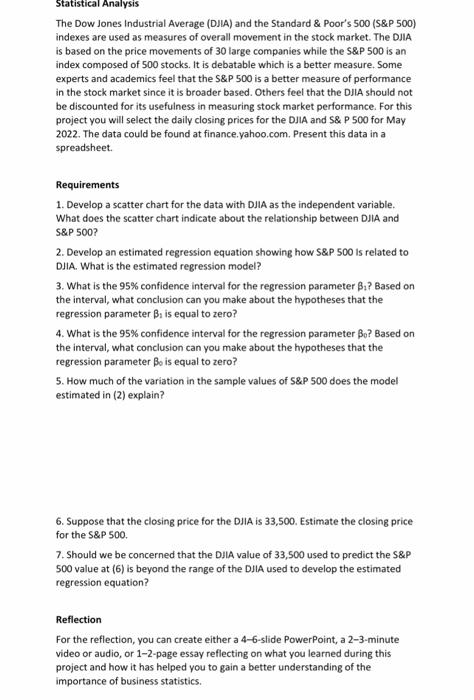
The Dow Jones Industrial Average (DJA) and the Standard \& Poor's 500 (S\&P 500) indexes are used as measures of overall movement in the stock market. The DJIA is based on the price movements of 30 large companies while the \( \$ \& P 500 \)amp;P500amp;P500 is an index composed of 500 stocks. It is debatable which is a better measure. Some experts and academics feel that the S\&P 500 is a better measure of performance in the stock market since it is broader based. Others feel that the DJIA should not be discounted for its usefulness in measuring stock market performance. For this project you will select the daily closing prices for the DJIA and S\& P 500 for May 2022. The data could be found at finance.yahoo.com. Present this data in a spreadsheet. Requirements 1. Develop a scatter chart for the data with DJlA as the independent variable. What does the scatter chart indicate about the relationship between DJA and S\&P 500 ? 2. Develop an estimated regression equation showing how S\&. 500 is related to DJIA. What is the estimated regression model? 3. What is the 95% confidence interval for the regression parameter 1 ? Based on the interval, what conclusion can you make about the hypotheses that the regression parameter 1 is equal to zero? 4. What is the 95% confidence interval for the regression parameter 0 ? Based on the interval, what conclusion can you make about the hypotheses that the regression parameter 0 is equal to zero? 5. How much of the variation in the sample values of S\&. 500 does the model estimated in (2) explain? 6. Suppose that the closing price for the DJA is 33,500. Estimate the closing price for the \( \$ \& P 500 \). 7. Should we be concerned that the DJA value of 33,500 used to predict the S\&P 500 value at (6) is beyond the range of the DJlA used to develop the estimated regression equation? Reflection For the reflection, you can create either a 4-6-slide PowerPoint, a 2-3-minute video or audio, or 1-2-page essay reflecting on what you learned during this project and how it has helped you to gain a better understanding of the importance of business statistics 
Step by Step Solution
There are 3 Steps involved in it
Step: 1

Get Instant Access to Expert-Tailored Solutions
See step-by-step solutions with expert insights and AI powered tools for academic success
Step: 2

Step: 3

Ace Your Homework with AI
Get the answers you need in no time with our AI-driven, step-by-step assistance
Get Started


