

Question
By April 2020, 44 states had instituted stay-at-home (SAH) orders to slow the spread of coronavirus disease 2019 (COVID-19). The duration of stay-at-home days varied
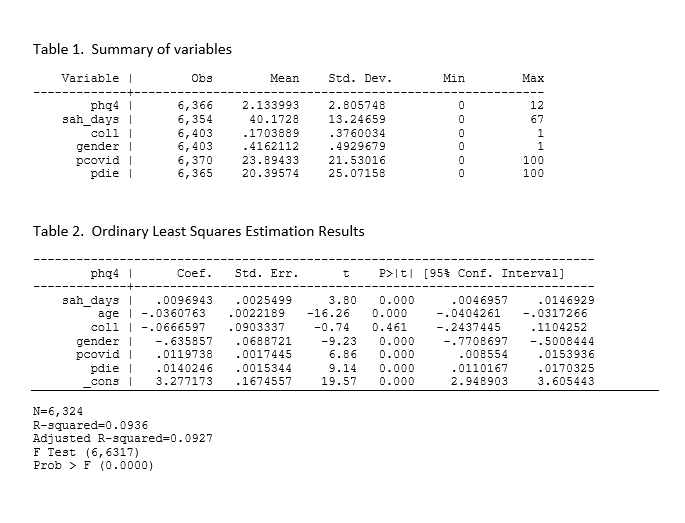
By April 2020, 44 states had instituted stay-at-home (SAH) orders to slow the spread of coronavirus disease 2019 (COVID-19). The duration of stay-at-home days varied across states, lasting from 3.5 weeks to over 2 months. The strategy reduced the spread of illness but had social and economic costs.While higher levels of psychological stress have been documented, we want to know how much stay-at-home orders contributed to psychological stress. We have data collected every two weeks between March 10 and May 24, 2020, from the Understanding America Study (UAS) COVID-19 survey, a probability-based Internet panel of about 9,000 US adults ages 18 and older.The UAS COVID-19 survey included the Patient Health Questionnaire for Depression and Anxiety (PHQ-4), which asks about feelings related to depression and anxiety and results in a score from 1 (no depression/anxiety) to 12 (highest level of depression/anxiety). We measured the number of days on stay-at-home orders based on the order date, respondents' state of residence, and survey completion date to create the variable of a number of stay-at-home days for each person (say days). We used ordinary least squares to estimate the relationship between PHQ-4 score and accumulated stay-at-home days and included in our model other potential confounders (variable name in output tables is in parenthesis): age (age), college-educated (coll), male gender (gender), probability of contracting COVID (pcovid), probability of dying from COVID (pdie).
a.What is the research question (state it as a question) and who might care about the answer?
b.Write out the empirical model in an equation format based on the information provided above.
c.What do you hypothesize is the relationship between the outcome, phq4, and the main predictor of interest, sah_days, and why?
d.You find the correlation coefficient is 0.061.Interpret the relationship based on the correlation coefficient
Table 1 provides summary statistics of the variables and Table 2 is the regression output.
e.How well does your model fit the data (be clear about what information provided you could be used to assess this and your interpretation of the information)?
f.Interpret the coefficient estimate on sah_days and conduct a hypothesis test.
g.Interpret the coefficient estimates on the following variables and conduct hypothesis tests: gender, pcovid
h.Was a causal relationship identified (i.e. is the coefficient estimate on the main predictor variable biased)?Why or why not?
Step by Step Solution
There are 3 Steps involved in it
Step: 1

Get Instant Access to Expert-Tailored Solutions
See step-by-step solutions with expert insights and AI powered tools for academic success
Step: 2

Step: 3
Ace Your Homework with AI
Get the answers you need in no time with our AI-driven, step-by-step assistance
Get Started
Applied Calculus
Authors: Stefan Waner, Steven Costenoble
6th Edition
1285415310, 9781285415314