Answered step by step
Verified Expert Solution
Question
1 Approved Answer
By comparing the data of the last six years, evaluate the financial position of the company. ANALYSIS OF STATEMENT OF FINANCIAL POSITION PKR in '000
By comparing the data of the last six years, evaluate the financial position of the company.
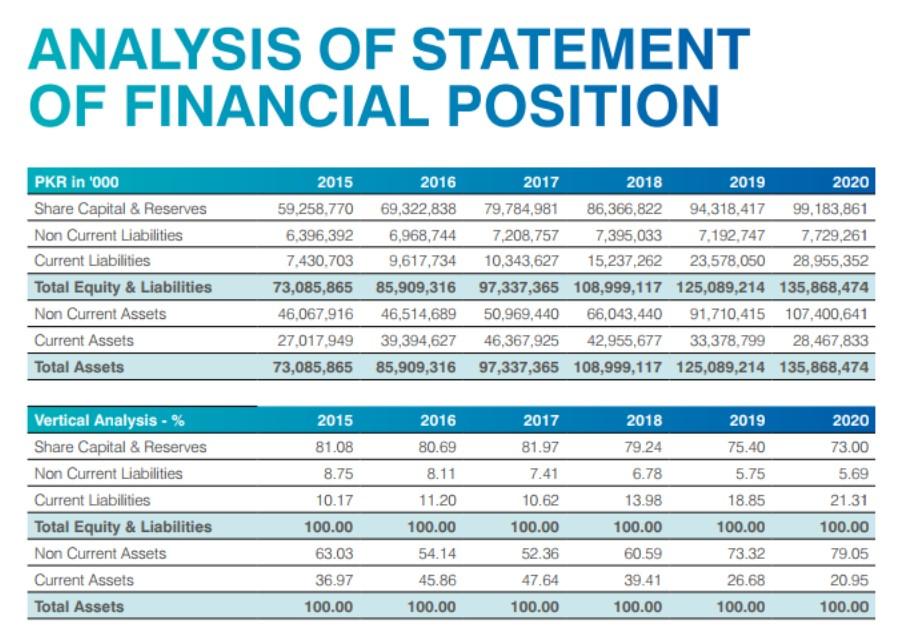
ANALYSIS OF STATEMENT OF FINANCIAL POSITION PKR in '000 Share Capital & Reserves Non Current Liabilities Current Liabilities Total Equity & Liabilities Non Current Assets Current Assets Total Assets 2015 2016 2017 2018 2019 2020 59,258,770 69,322,838 79,784,981 86,366,822 94,318,417 99,183,861 6,396,392 6,968,744 7,208,757 7,395,033 7.192.747 7,729,261 7.430.703 9,617,734 10,343,627 15,237,262 23,578,050 28,955,352 73,085,865 85,909,316 97,337,365 108,999,117 125,089,214 135,868,474 46,067,916 46,514,689 50.969,440 66,043,440 91.710.415 107,400,641 27.017,949 39,394,627 46,367,925 42,955,677 33,378,799 28,467,833 73,085,865 85,909,316 97,337,365 108,999,117 125,089,214 135,868,474 2015 81.08 2016 80.69 2017 81.97 2018 79.24 8.75 8.11 7.41 6.78 10.62 Vertical Analysis - % Share Capital & Reserves Non Current Liabilities Current Liabilities Total Equity & Liabilities Non Current Assets Current Assets Total Assets 10.17 100.00 63.03 36.97 100.00 11.20 100.00 54.14 45.86 100.00 100.00 2019 75.40 5.75 18.85 100.00 73.32 26.68 100.00 2020 73.00 5.69 21.31 100.00 79.05 20.95 100.00 13.98 100.00 60.59 39.41 100.00 52.36 47.64 100.00Step by Step Solution
There are 3 Steps involved in it
Step: 1
Get Instant Access to Expert-Tailored Solutions
See step-by-step solutions with expert insights and AI powered tools for academic success
Step: 2
Step: 3
Ace Your Homework with AI
Get the answers you need in no time with our AI-driven, step-by-step assistance
Get Started