

Question
By setting r=1, C=100 and t = 0:20, plot the bacteria growth for K = 1000, K = 3000, and K = 5000. Note that
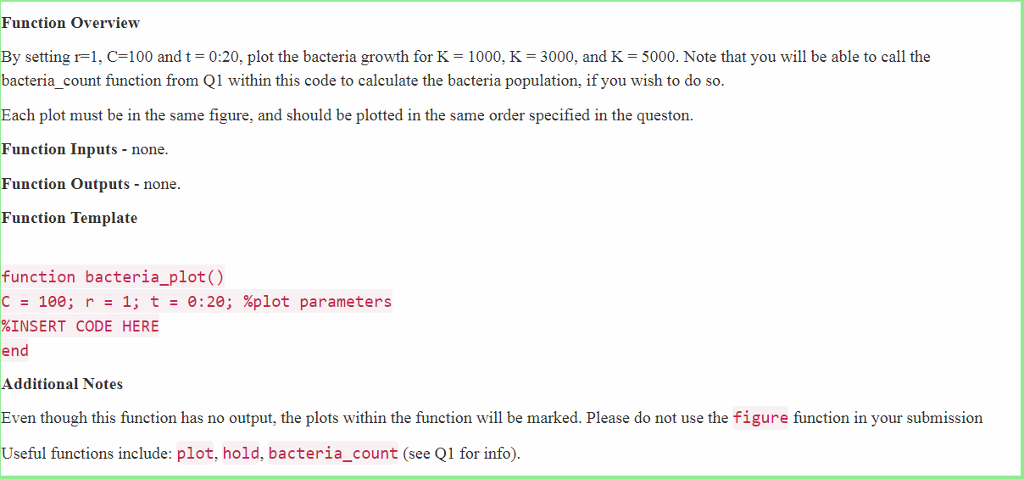
By setting r=1, C=100 and t = 0:20, plot the bacteria growth for K = 1000, K = 3000, and K = 5000. Note that you will be able to call the bacteria_count function from Q1 within this code to calculate the bacteria population, if you wish to do so.
Each plot must be in the same figure, and should be plotted in the same order specified in the queston.
Step by Step Solution
There are 3 Steps involved in it
Step: 1

Get Instant Access to Expert-Tailored Solutions
See step-by-step solutions with expert insights and AI powered tools for academic success
Step: 2

Step: 3
Ace Your Homework with AI
Get the answers you need in no time with our AI-driven, step-by-step assistance
Get Started
Rules In Database Systems Second International Workshop Rids 95 Glyfada Athens Greece September 25 27 1995 Proceedings Lncs 985
Authors: Timos Sellis
1995th Edition
3540603654, 978-3540603658