By studying the financial market for a long time, a connection has been found between what is called Bull, Bear and Recession. A market is
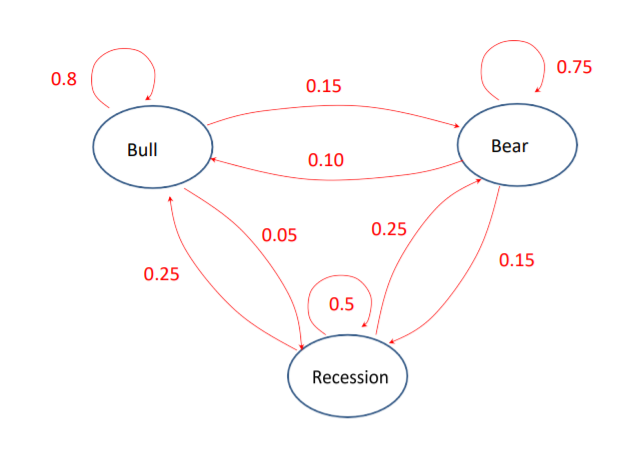
By studying the financial market for a long time, a connection has been found between what is called Bull, Bear and Recession. A market is in Bull when you expect an upturn, Bear if you expect a downturn and it's really bad we have Recession, which often coincides with the outside world in rocking as e.g. at the financial crisis in 2008. The relationship for a given week is illustrated in Figure 1:

Figure 1: Current market situation during a given week
From Figure 1, it is possible to calculate how the distribution can be expected to be in the long term for Bull, Bear and Recession. This can be helpful for those who invest in the market.
questions:
(a) Set up the transfer matrix for the problem in Figure 1 so that the line sum becomes 1.
(b) Assume a start vector (row vector) and a tolerance level and make a program that iteratively calculates how the state probabilities converge towards a stationary solution. Describe it method you have chosen to calculate the error compared to the tolerance level; is it a one-norm (the sum of the absolute amounts of errors), two-norm (the root from the mean of square errors) or infinity standard (max of absolute amounts)?
And I need to write the answers on program that called matlab? Can you write the answer like you answer on program matlab? I need the code in matlab?
Thanks
0.75 0.8 0.15 Bull Bear 0.10 0.05 0.25 0.15 0.25 0.5 Recession 0.75 0.8 0.15 Bull Bear 0.10 0.05 0.25 0.15 0.25 0.5 RecessionStep by Step Solution
There are 3 Steps involved in it
Step: 1

See step-by-step solutions with expert insights and AI powered tools for academic success
Step: 2

Step: 3

Ace Your Homework with AI
Get the answers you need in no time with our AI-driven, step-by-step assistance
Get Started


