

Answered step by step
Verified Expert Solution
Question
1 Approved Answer
by using below dataset can you please answer this quetions. Use Microsoft Excel or Tableau or one of the other visualization tools and create 3
by using below dataset can you please answer this quetions.
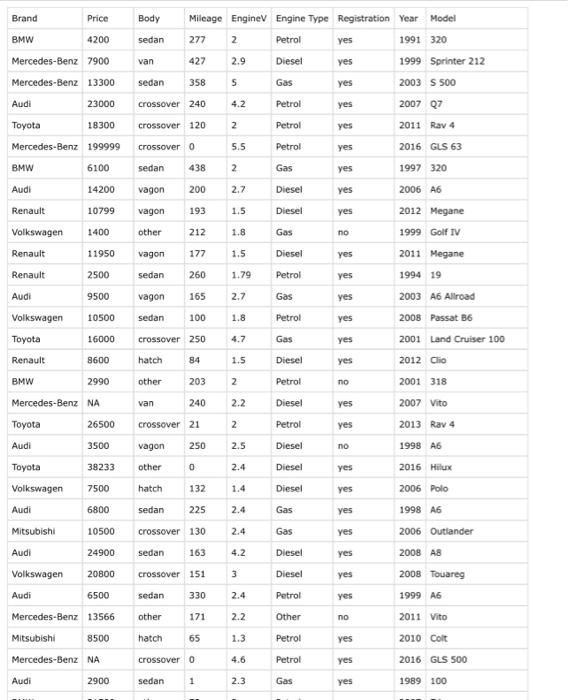
- Use Microsoft Excel or Tableau or one of the other visualization tools and create 3 visuals(graphs/charts):
- First chart should at-least use 2 data columns
- Second chart should at-least use 3 data columns
- Third chart should also use at-least 3 data columns
These charts should show the legends correctly.
Take screens shots and explain the dependencies that you have shown in these visuals in your report to submit.
Step by Step Solution
There are 3 Steps involved in it
Step: 1

Get Instant Access to Expert-Tailored Solutions
See step-by-step solutions with expert insights and AI powered tools for academic success
Step: 2

Step: 3
Ace Your Homework with AI
Get the answers you need in no time with our AI-driven, step-by-step assistance
Get Started
Beginning Microsoft SQL Server 2012 Programming
Authors: Paul Atkinson, Robert Vieira
1st Edition
1118102282, 9781118102282