

Answered step by step
Verified Expert Solution
Question
1 Approved Answer
by using matlab program Summary For homework 1, you will create one function named Hw1_### # # # # # (where ### is replaced by
by using matlab program 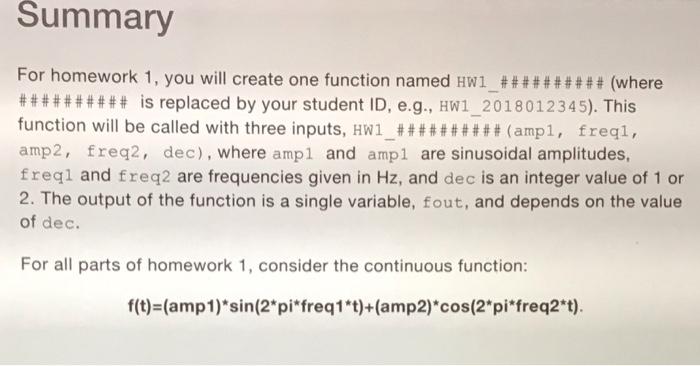
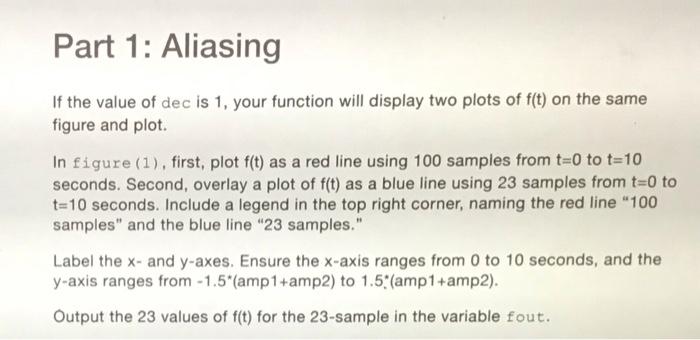
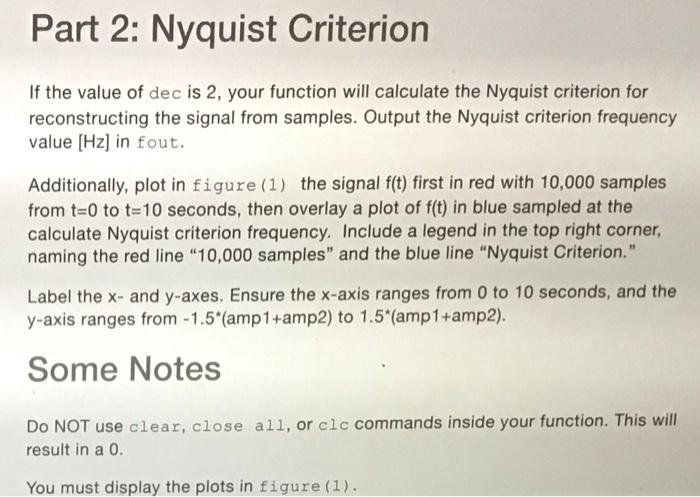
Summary For homework 1, you will create one function named Hw1_### # # # # # (where ### is replaced by your student ID, e.g., HW1_2018012345). This function will be called with three inputs, Hw1_# # # # # # # # # # (ampl, freqi, amp2, freq2, dec), where ampl and ampl are sinusoidal amplitudes, freqi and freq2 are frequencies given in Hz, and dec is an integer value of 1 or 2. The output of the function is a single variable, fout, and depends on the value of dec. For all parts of homework 1, consider the continuous function: f(t)=(amp 1)*sin(2*pi*freq1*t)+(amp2)*cos(2*pi*freq2*t). Part 1: Aliasing If the value of dec is 1, your function will display two plots of f(t) on the same figure and plot. In figure (1), first, plot f(t) as a red line using 100 samples from t=0 to t=10 seconds. Second, overlay a plot of f(t) as a blue line using 23 samples from t=0 to t=10 seconds. Include a legend in the top right corner, naming the red line "100 samples" and the blue line "23 samples." Label the x- and y-axes. Ensure the x-axis ranges from 0 to 10 seconds, and the y-axis ranges from - 1.5" (amp1 +amp2) to 1.5*(amp1+amp2). Output the 23 values of f(t) for the 23-sample in the variable fout. Part 2: Nyquist Criterion If the value of dec is 2, your function will calculate the Nyquist criterion for reconstructing the signal from samples. Output the Nyquist criterion frequency value [Hz] in fout. Additionally, plot in figure (1) the signal f(t) first in red with 10,000 samples from t=0 to t=10 seconds, then overlay a plot of f(t) in blue sampled at the calculate Nyquist criterion frequency. Include a legend in the top right corner, naming the red line "10,000 samples" and the blue line "Nyquist Criterion." Label the x- and y-axes. Ensure the x-axis ranges from 0 to 10 seconds, and the y-axis ranges from -1.5"(amp1+amp2) to 1.5*(amp 1+amp2). Some Notes Do NOT use clear, close all, or clc commands inside your function. This will result in a 0. You must display the plots in figure (1) Step by Step Solution
There are 3 Steps involved in it
Step: 1

Get Instant Access to Expert-Tailored Solutions
See step-by-step solutions with expert insights and AI powered tools for academic success
Step: 2

Step: 3
Ace Your Homework with AI
Get the answers you need in no time with our AI-driven, step-by-step assistance
Get Started
Oracle Database Programming With Visual Basic.NET Concepts Designs And Implementations
Authors: Ying Bai
1st Edition
1119734398, 978-1119734390