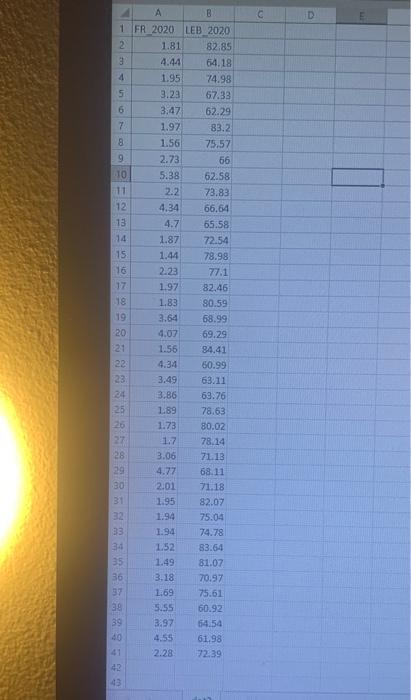
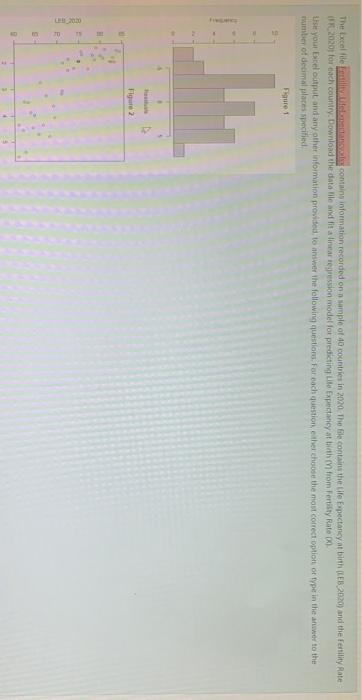
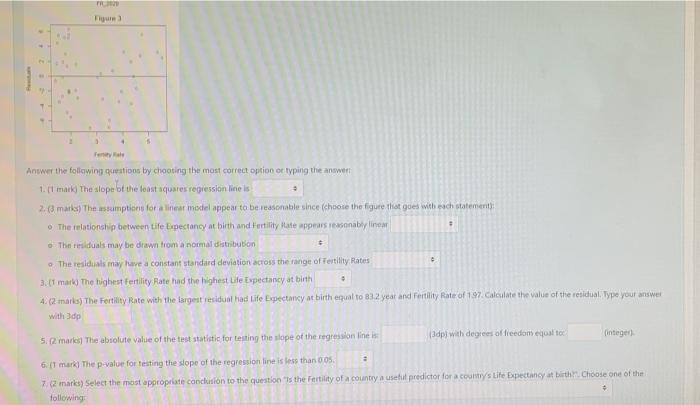
C B 1 FR 2020 LEB_2020 2 1.81 82.85 3 4.44 64.18 4 1.95 74.98 5 3.29 67.33 6 3.47 62.29 7 1.97 83.2 8 1.56 75,57 9 2.73 66 10 5.38 62.58 11 2.2 73.83 12 4.34 66.64 13 65.58 14 4.7 1.87 1.44 72.54 78.98 15 16 2.23 77.1 17 1.97 82.46 18 80.59 19 1.83 3.64 4.07 68.99 69.29 20 21 1.55 84.41 22 4.34 50.99 63.11 23 24 3.49 3,86 63.76 25 1.89 78.63 26 1.73 80.02 27 78.14 28 3.06 71.13 39 4.77 68.11 2.01 71.18 31 1195 82.07 32 1.94 75.04 1.94 74.78 33 34 1.52 83.64 35 1.49 81.07 36 3.18 70.97 37 1,69 38 5.55 75.61 60.92 64.54 3.97 39 40 4.55 61.98 72.39 2.28 42 43 The Excel file contains information recorded on a sample of 40 countries in 2020. The file contains the life fpectancy at birth (LEB-2020) and the fertility Rate 2030 torch country. Download the data lile and it a linear regression model for predicting Lito Expectancy at the from Peristy Rate Lise your relatput and any other information provided to answer the following questions. For each question the choose the most correct option or type in the answer to the number of decimal places specified Figure Figure 2 Figur Fenty Answer the following questions by choosing the most correct option of typing the answer 1. [1 mark) The slope of the least squares regression lines 2. (3 mars) The stumptions for a linear model appear to be reasonable since (choose the figure that goes with each statements The relationship between Life Expectancy at birth and Fertility Matemppears asonably linea The residuals may be drawn from a normal distribution The residuals may have a constant standard deviation across the range of Tertility Rates 3. [1 mark The highest Fertility Rate had the highest Life Expectancy at birth 4. (2) The Fertility Rate with the largest residual had Life Expectancy at birth equal to 12 year and Fertility Rate of 197. Calculate the value of the residual. Type your answer with 3dp 3dpl with degrees of freedom equal to integer 5.2 marks) The absolute value of the test statistic for testing the slope of the regression line is 2 6. IT mark The p-value for testing the slope of the regression line is less than 0.05. the question is the Fertility of a country a usetit predictor for a country's Life Expectancy at birthy Choose one of the 7.2 marks) Select the most appropriate conclusion following 2. marks the ansumptions for a linear model appear to be reasonable since choose the figure that goes with each statement The relationship between Life Expectancy at birth and fertility Rate appears asonably linea The residuals may be drawn from a normal distribution The residuals may have a constant standard deviation across the range of fertility Rates 3. [1 mark the highest Fertility Rate had the highest Lite Expectancy at birth 4. maila) The Fertility Rate with the largest residual had uite Expectancy at birth equal to 1.2 year and Fertility Bite of 197. calculate the value of the residual Type your answer with 3dp 5. marsThe abiolute value of the test statistic for testing the slope of the regression line le 3dp) with degrees of freedom culto integer 6:41 marki The p value for testing the slope of the regression in a few than 0.0% 7.12 marks Select the most appropriate conclusion to the question is the fertility of a country useful predictor for a country's Life Expectancy of birth. Choose one of the following A There is a significant negative linear relationship between Life Expectancy at birth (LER-2020) and the Fertility Rate FR 2020. There it not enough evidence to indicate that the Fertility Rate FR.20201 is a useful predictor of a country's Life Expectarsey at births 2020) C. There is a significant positive Snear telationship between Lite Expectancy at bith 1168_2020) and the Fertility Rate FR 2000). Clopcemember to include a negative sign it appropriate (1 mark) The correlationis 9.2 marku) Use the regression equation to predict the life Expectancy at birth for a country which has a Fertility Rate of 5 Odph 10.03 marks we are 95% confident that for each extra Fertility Rate the average Life Expectancy tirth i pected to between absolute value of lower limit years and absolute valot of upper limiti years. Type your answers with 3dp C B 1 FR 2020 LEB_2020 2 1.81 82.85 3 4.44 64.18 4 1.95 74.98 5 3.29 67.33 6 3.47 62.29 7 1.97 83.2 8 1.56 75,57 9 2.73 66 10 5.38 62.58 11 2.2 73.83 12 4.34 66.64 13 65.58 14 4.7 1.87 1.44 72.54 78.98 15 16 2.23 77.1 17 1.97 82.46 18 80.59 19 1.83 3.64 4.07 68.99 69.29 20 21 1.55 84.41 22 4.34 50.99 63.11 23 24 3.49 3,86 63.76 25 1.89 78.63 26 1.73 80.02 27 78.14 28 3.06 71.13 39 4.77 68.11 2.01 71.18 31 1195 82.07 32 1.94 75.04 1.94 74.78 33 34 1.52 83.64 35 1.49 81.07 36 3.18 70.97 37 1,69 38 5.55 75.61 60.92 64.54 3.97 39 40 4.55 61.98 72.39 2.28 42 43 The Excel file contains information recorded on a sample of 40 countries in 2020. The file contains the life fpectancy at birth (LEB-2020) and the fertility Rate 2030 torch country. Download the data lile and it a linear regression model for predicting Lito Expectancy at the from Peristy Rate Lise your relatput and any other information provided to answer the following questions. For each question the choose the most correct option or type in the answer to the number of decimal places specified Figure Figure 2 Figur Fenty Answer the following questions by choosing the most correct option of typing the answer 1. [1 mark) The slope of the least squares regression lines 2. (3 mars) The stumptions for a linear model appear to be reasonable since (choose the figure that goes with each statements The relationship between Life Expectancy at birth and Fertility Matemppears asonably linea The residuals may be drawn from a normal distribution The residuals may have a constant standard deviation across the range of Tertility Rates 3. [1 mark The highest Fertility Rate had the highest Life Expectancy at birth 4. (2) The Fertility Rate with the largest residual had Life Expectancy at birth equal to 12 year and Fertility Rate of 197. Calculate the value of the residual. Type your answer with 3dp 3dpl with degrees of freedom equal to integer 5.2 marks) The absolute value of the test statistic for testing the slope of the regression line is 2 6. IT mark The p-value for testing the slope of the regression line is less than 0.05. the question is the Fertility of a country a usetit predictor for a country's Life Expectancy at birthy Choose one of the 7.2 marks) Select the most appropriate conclusion following 2. marks the ansumptions for a linear model appear to be reasonable since choose the figure that goes with each statement The relationship between Life Expectancy at birth and fertility Rate appears asonably linea The residuals may be drawn from a normal distribution The residuals may have a constant standard deviation across the range of fertility Rates 3. [1 mark the highest Fertility Rate had the highest Lite Expectancy at birth 4. maila) The Fertility Rate with the largest residual had uite Expectancy at birth equal to 1.2 year and Fertility Bite of 197. calculate the value of the residual Type your answer with 3dp 5. marsThe abiolute value of the test statistic for testing the slope of the regression line le 3dp) with degrees of freedom culto integer 6:41 marki The p value for testing the slope of the regression in a few than 0.0% 7.12 marks Select the most appropriate conclusion to the question is the fertility of a country useful predictor for a country's Life Expectancy of birth. Choose one of the following A There is a significant negative linear relationship between Life Expectancy at birth (LER-2020) and the Fertility Rate FR 2020. There it not enough evidence to indicate that the Fertility Rate FR.20201 is a useful predictor of a country's Life Expectarsey at births 2020) C. There is a significant positive Snear telationship between Lite Expectancy at bith 1168_2020) and the Fertility Rate FR 2000). Clopcemember to include a negative sign it appropriate (1 mark) The correlationis 9.2 marku) Use the regression equation to predict the life Expectancy at birth for a country which has a Fertility Rate of 5 Odph 10.03 marks we are 95% confident that for each extra Fertility Rate the average Life Expectancy tirth i pected to between absolute value of lower limit years and absolute valot of upper limiti years. Type your answers with 3dp


