Answered step by step
Verified Expert Solution
Link Copied!

Question

1 Approved Answer

C C2 Expenditures C. Output y Figure 11.1 In Figure 11.1, an increase in the marginal propensity to save is represented by a change in
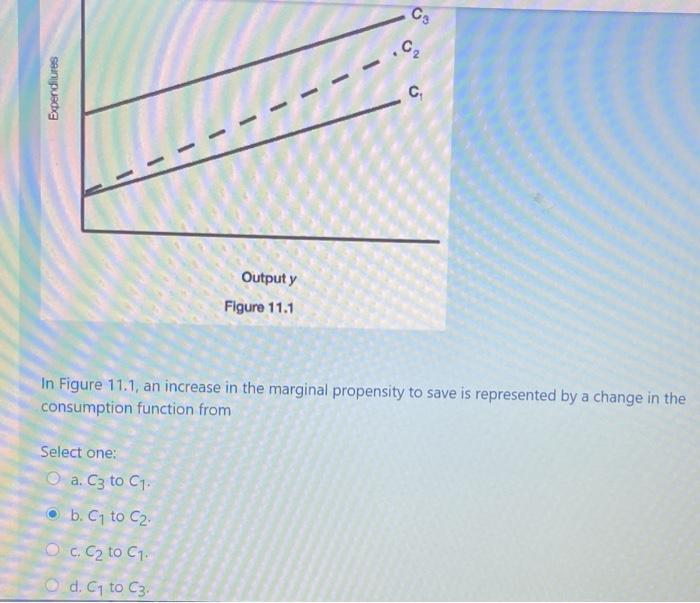
image text in transcribed
C C2 Expenditures C. Output y Figure 11.1 In Figure 11.1, an increase in the marginal propensity to save is represented by a change in the consumption function from Select one: O a. C3 to C1 b. C1 to C2 O c. Cz to ca. d. Co to C3

Step by Step Solution

There are 3 Steps involved in it

Step: 1

blur-text-image

Get Instant Access to Expert-Tailored Solutions

See step-by-step solutions with expert insights and AI powered tools for academic success

Step: 2

blur-text-image

Step: 3

blur-text-image

Ace Your Homework with AI

Get the answers you need in no time with our AI-driven, step-by-step assistance

Get Started

Recommended Textbook for

Using Stata For Principles Of Econometrics

Authors: Adkins, Lee C Adkins, R Carter Hill

4th Edition

111803208X, 9781118032084

More Books

Students also viewed these Economics questions

Question

What are the determinants of cash cycle ? Explain

Answered: 1 week ago