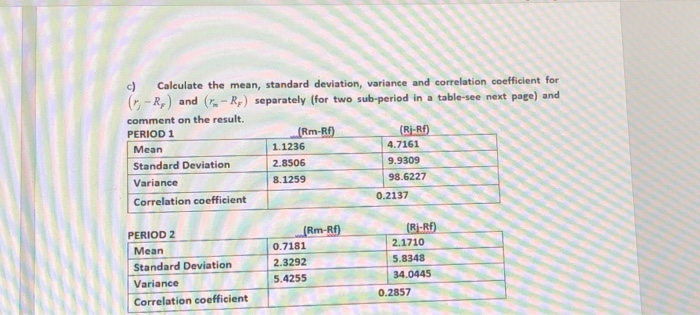
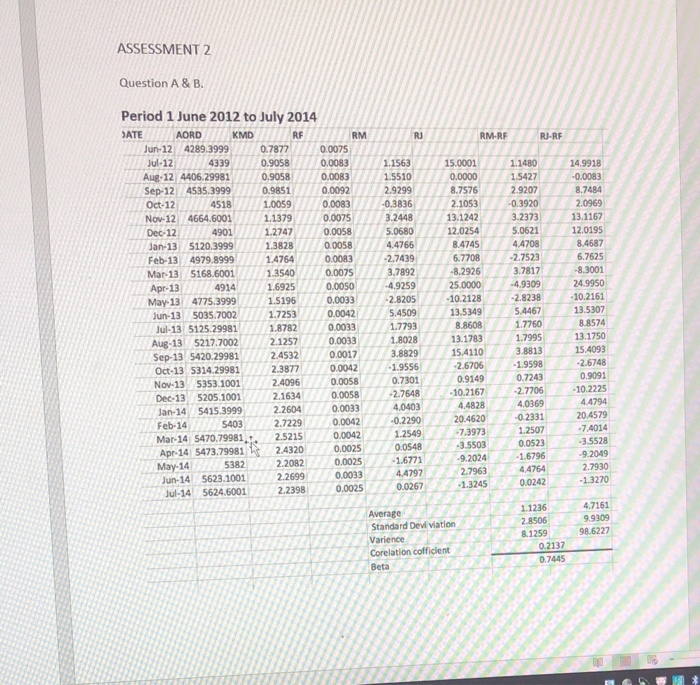
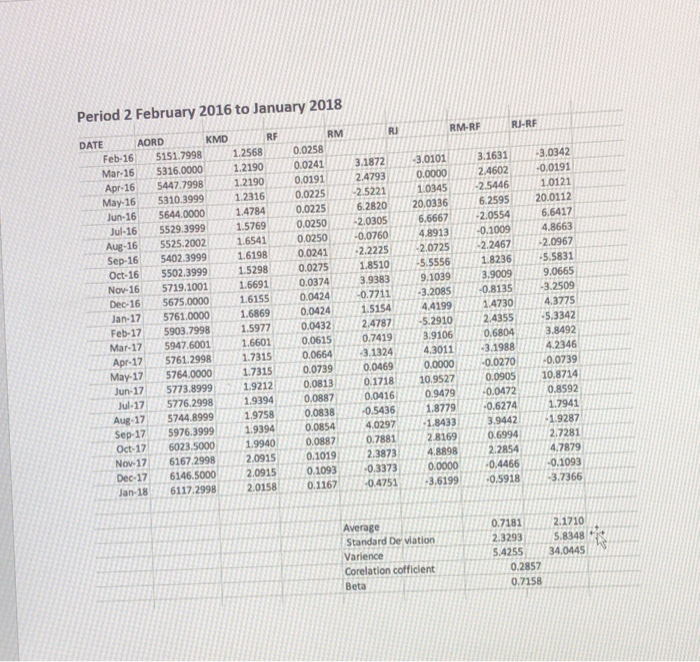
c) Caleulate the mean, standard deviation, variance and correlation coefficient for ( -R) and (-R) separately (for two sub-period in a table-see next page) and comment on the result PERIOD 1 (Rm-Rf Mean Standard Deviation Variance Correlation coefficient 1.1236 2.8506 8.1259 4.7161 9.9309 98.6227 0.2137 PERIOD 2 Mean Standard Deviation Variance Correlation coefficient 0.7181 2.3292 5.4255 2.1710 5.8348 4.0445 0.2857 Period 1 June 2012 to July 2014 RM-RF RF KMD Period 2 February 2016 to January 2018 RF RJ-RF KMD RM RJ RM-RF DATE AORD Feb-16 5151.7998 1.25680.0258 Mar-165316.00001.21900,02413 872-3 0101I3.16313.0342 Apr-16 5447.79981.21900.01912.4793Il0.00002.4602-0.0191 May-16 5310.39991 Jun-16 5644.00001.4784 0.02256.2820 20.03366.259520.0112 0121 03452.54461 .23160.0225-2.5221 Jul-165529.399915769 0.0250-2.03056.6667 -2.05546.6417 Aug-16 5525.20021.65410.0250-0.07604.8913 0.10094.8663 Sep-16 5402.3999 Oct-165502.3999 1.5298 0.02751.8510 ....-5ss56- 18236/ 5.5831 Nov-165719.1001 Dec-165675.0000 Jan-17 5761.0000 1.6869 0.0424 1.5154| 44199.. 14730.437751 Feb-175903.79981.5977004322.4787-.29102.4355-5.3342 Mar-17 5947 60011.66010.06150.7419.91060.68043.8492 Apr-17 5761.2998 16198 0.024122225 2.0967 2.07252.2467 66910.0374 .61550.0424-0.7711 3.2085-0.8135 .93839.1039 3.9009 3.2509 73150.06643.1324 .30113.1988 - May-17 5764.0000 1.7315 0.0739 0.0469 0.0000-0.0270 .00739 Jun-175773.89991.92120.08130.171810.95270.090510.8714 Jul-175776.2998 1.9394 0.08870.04160.9479-0.04720.8592 Aug-17 5744.89991.97580.08380 Sep-175976.3999.9394 0.08544.02971.84333.94429287 0.54361.8779-0.6274.7941 Oct-17 6023 50001.99400.08870788128169 0 6994 111127281 4.88982.28544.7879 0146 500020915 0117 29982.0915 Nov-176167.2998 Dec-17 6146.50002.0915 0.10930.33730.0000-0.4466 -0.1093 an-186117.29982.01580.1167 2.0915 10192.3873 047513.61990.591837366 a-18 0.11670.3373.88980.699 Average Standard De viation Varience Corelation cofficient 2.1710 + .718121 32935.8348 425534.0445 Beta 0.2857 0.7158 c) Caleulate the mean, standard deviation, variance and correlation coefficient for ( -R) and (-R) separately (for two sub-period in a table-see next page) and comment on the result PERIOD 1 (Rm-Rf Mean Standard Deviation Variance Correlation coefficient 1.1236 2.8506 8.1259 4.7161 9.9309 98.6227 0.2137 PERIOD 2 Mean Standard Deviation Variance Correlation coefficient 0.7181 2.3292 5.4255 2.1710 5.8348 4.0445 0.2857 Period 1 June 2012 to July 2014 RM-RF RF KMD Period 2 February 2016 to January 2018 RF RJ-RF KMD RM RJ RM-RF DATE AORD Feb-16 5151.7998 1.25680.0258 Mar-165316.00001.21900,02413 872-3 0101I3.16313.0342 Apr-16 5447.79981.21900.01912.4793Il0.00002.4602-0.0191 May-16 5310.39991 Jun-16 5644.00001.4784 0.02256.2820 20.03366.259520.0112 0121 03452.54461 .23160.0225-2.5221 Jul-165529.399915769 0.0250-2.03056.6667 -2.05546.6417 Aug-16 5525.20021.65410.0250-0.07604.8913 0.10094.8663 Sep-16 5402.3999 Oct-165502.3999 1.5298 0.02751.8510 ....-5ss56- 18236/ 5.5831 Nov-165719.1001 Dec-165675.0000 Jan-17 5761.0000 1.6869 0.0424 1.5154| 44199.. 14730.437751 Feb-175903.79981.5977004322.4787-.29102.4355-5.3342 Mar-17 5947 60011.66010.06150.7419.91060.68043.8492 Apr-17 5761.2998 16198 0.024122225 2.0967 2.07252.2467 66910.0374 .61550.0424-0.7711 3.2085-0.8135 .93839.1039 3.9009 3.2509 73150.06643.1324 .30113.1988 - May-17 5764.0000 1.7315 0.0739 0.0469 0.0000-0.0270 .00739 Jun-175773.89991.92120.08130.171810.95270.090510.8714 Jul-175776.2998 1.9394 0.08870.04160.9479-0.04720.8592 Aug-17 5744.89991.97580.08380 Sep-175976.3999.9394 0.08544.02971.84333.94429287 0.54361.8779-0.6274.7941 Oct-17 6023 50001.99400.08870788128169 0 6994 111127281 4.88982.28544.7879 0146 500020915 0117 29982.0915 Nov-176167.2998 Dec-17 6146.50002.0915 0.10930.33730.0000-0.4466 -0.1093 an-186117.29982.01580.1167 2.0915 10192.3873 047513.61990.591837366 a-18 0.11670.3373.88980.699 Average Standard De viation Varience Corelation cofficient 2.1710 + .718121 32935.8348 425534.0445 Beta 0.2857 0.7158