c. Compute and tabulate the daily demand for each month in the table below (round off to the nearest whole number). (6 marks) MONTH PRODUCTION
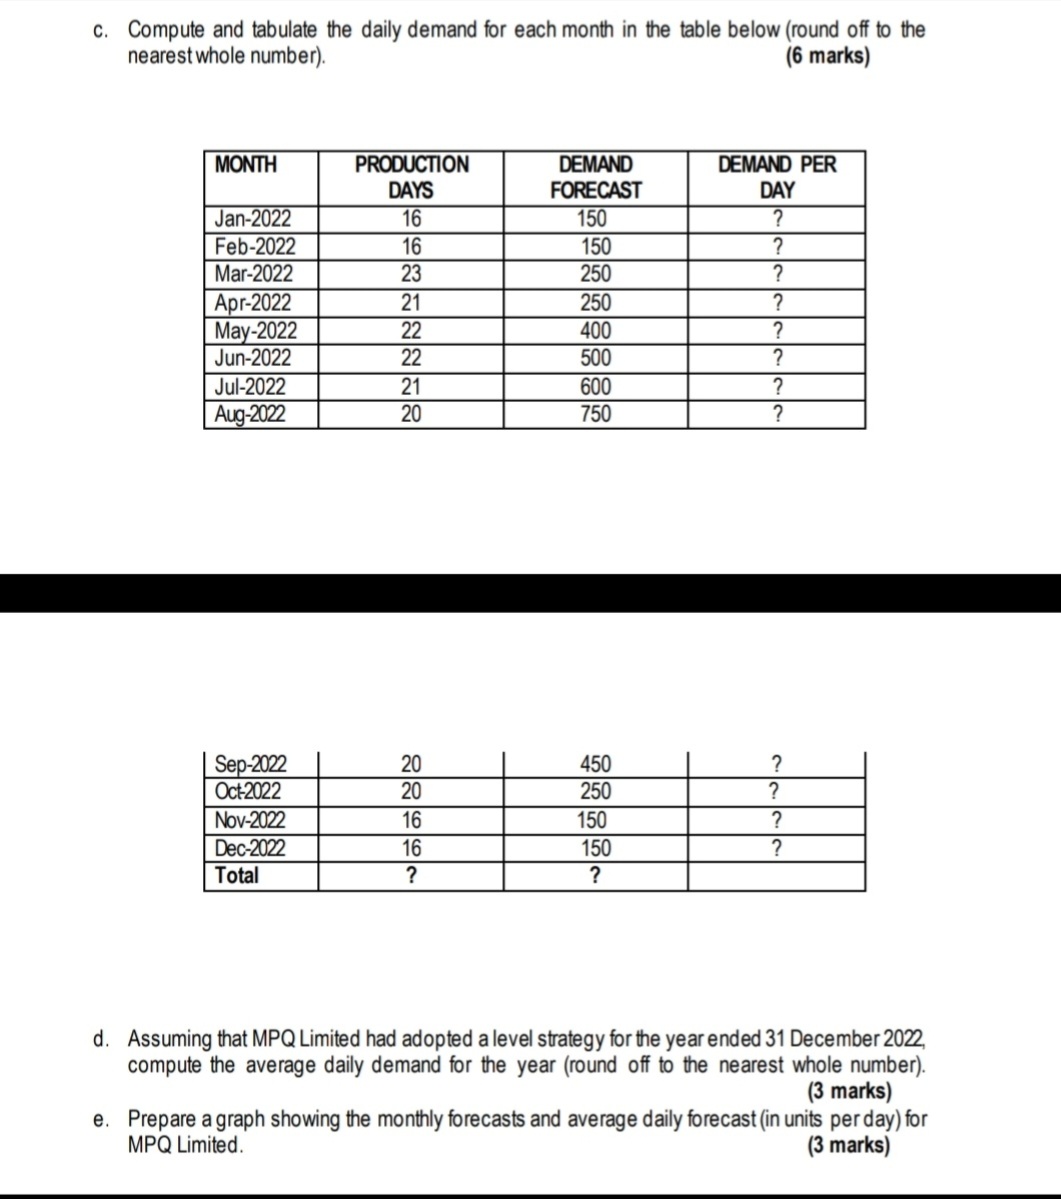
c. Compute and tabulate the daily demand for each month in the table below (round off to the nearest whole number). (6 marks) MONTH PRODUCTION DEMAND DEMAND PER DAYS FORECAST DAY Jan-2022 16 150 ? Feb-2022 16 150 Mar-2022 23 250 Apr-2022 21 250 ? May-2022 22 400 Jun-2022 22 500 Jul-2022 21 600 Aug-2022 20 750 Sep-2022 20 450 Oct-2022 20 250 Nov-2022 16 150 Dec-2022 16 150 7 Total ? d. Assuming that MPQ Limited had adopted a level strategy for the year ended 31 December 2022, compute the average daily demand for the year (round off to the nearest whole number). (3 marks) e. Prepare a graph showing the monthly forecasts and average daily forecast (in units per day) for MPQ Limited
Step by Step Solution
There are 3 Steps involved in it
Step: 1
Get Instant Access to Expert-Tailored Solutions
See step-by-step solutions with expert insights and AI powered tools for academic success
Step: 2
Step: 3
Ace Your Homework with AI
Get the answers you need in no time with our AI-driven, step-by-step assistance