

Question
C. Determine the critical value X2a= type in integer or decimal rounded to two decimal places as needed. D. Since x2 ___ x2a ______ the
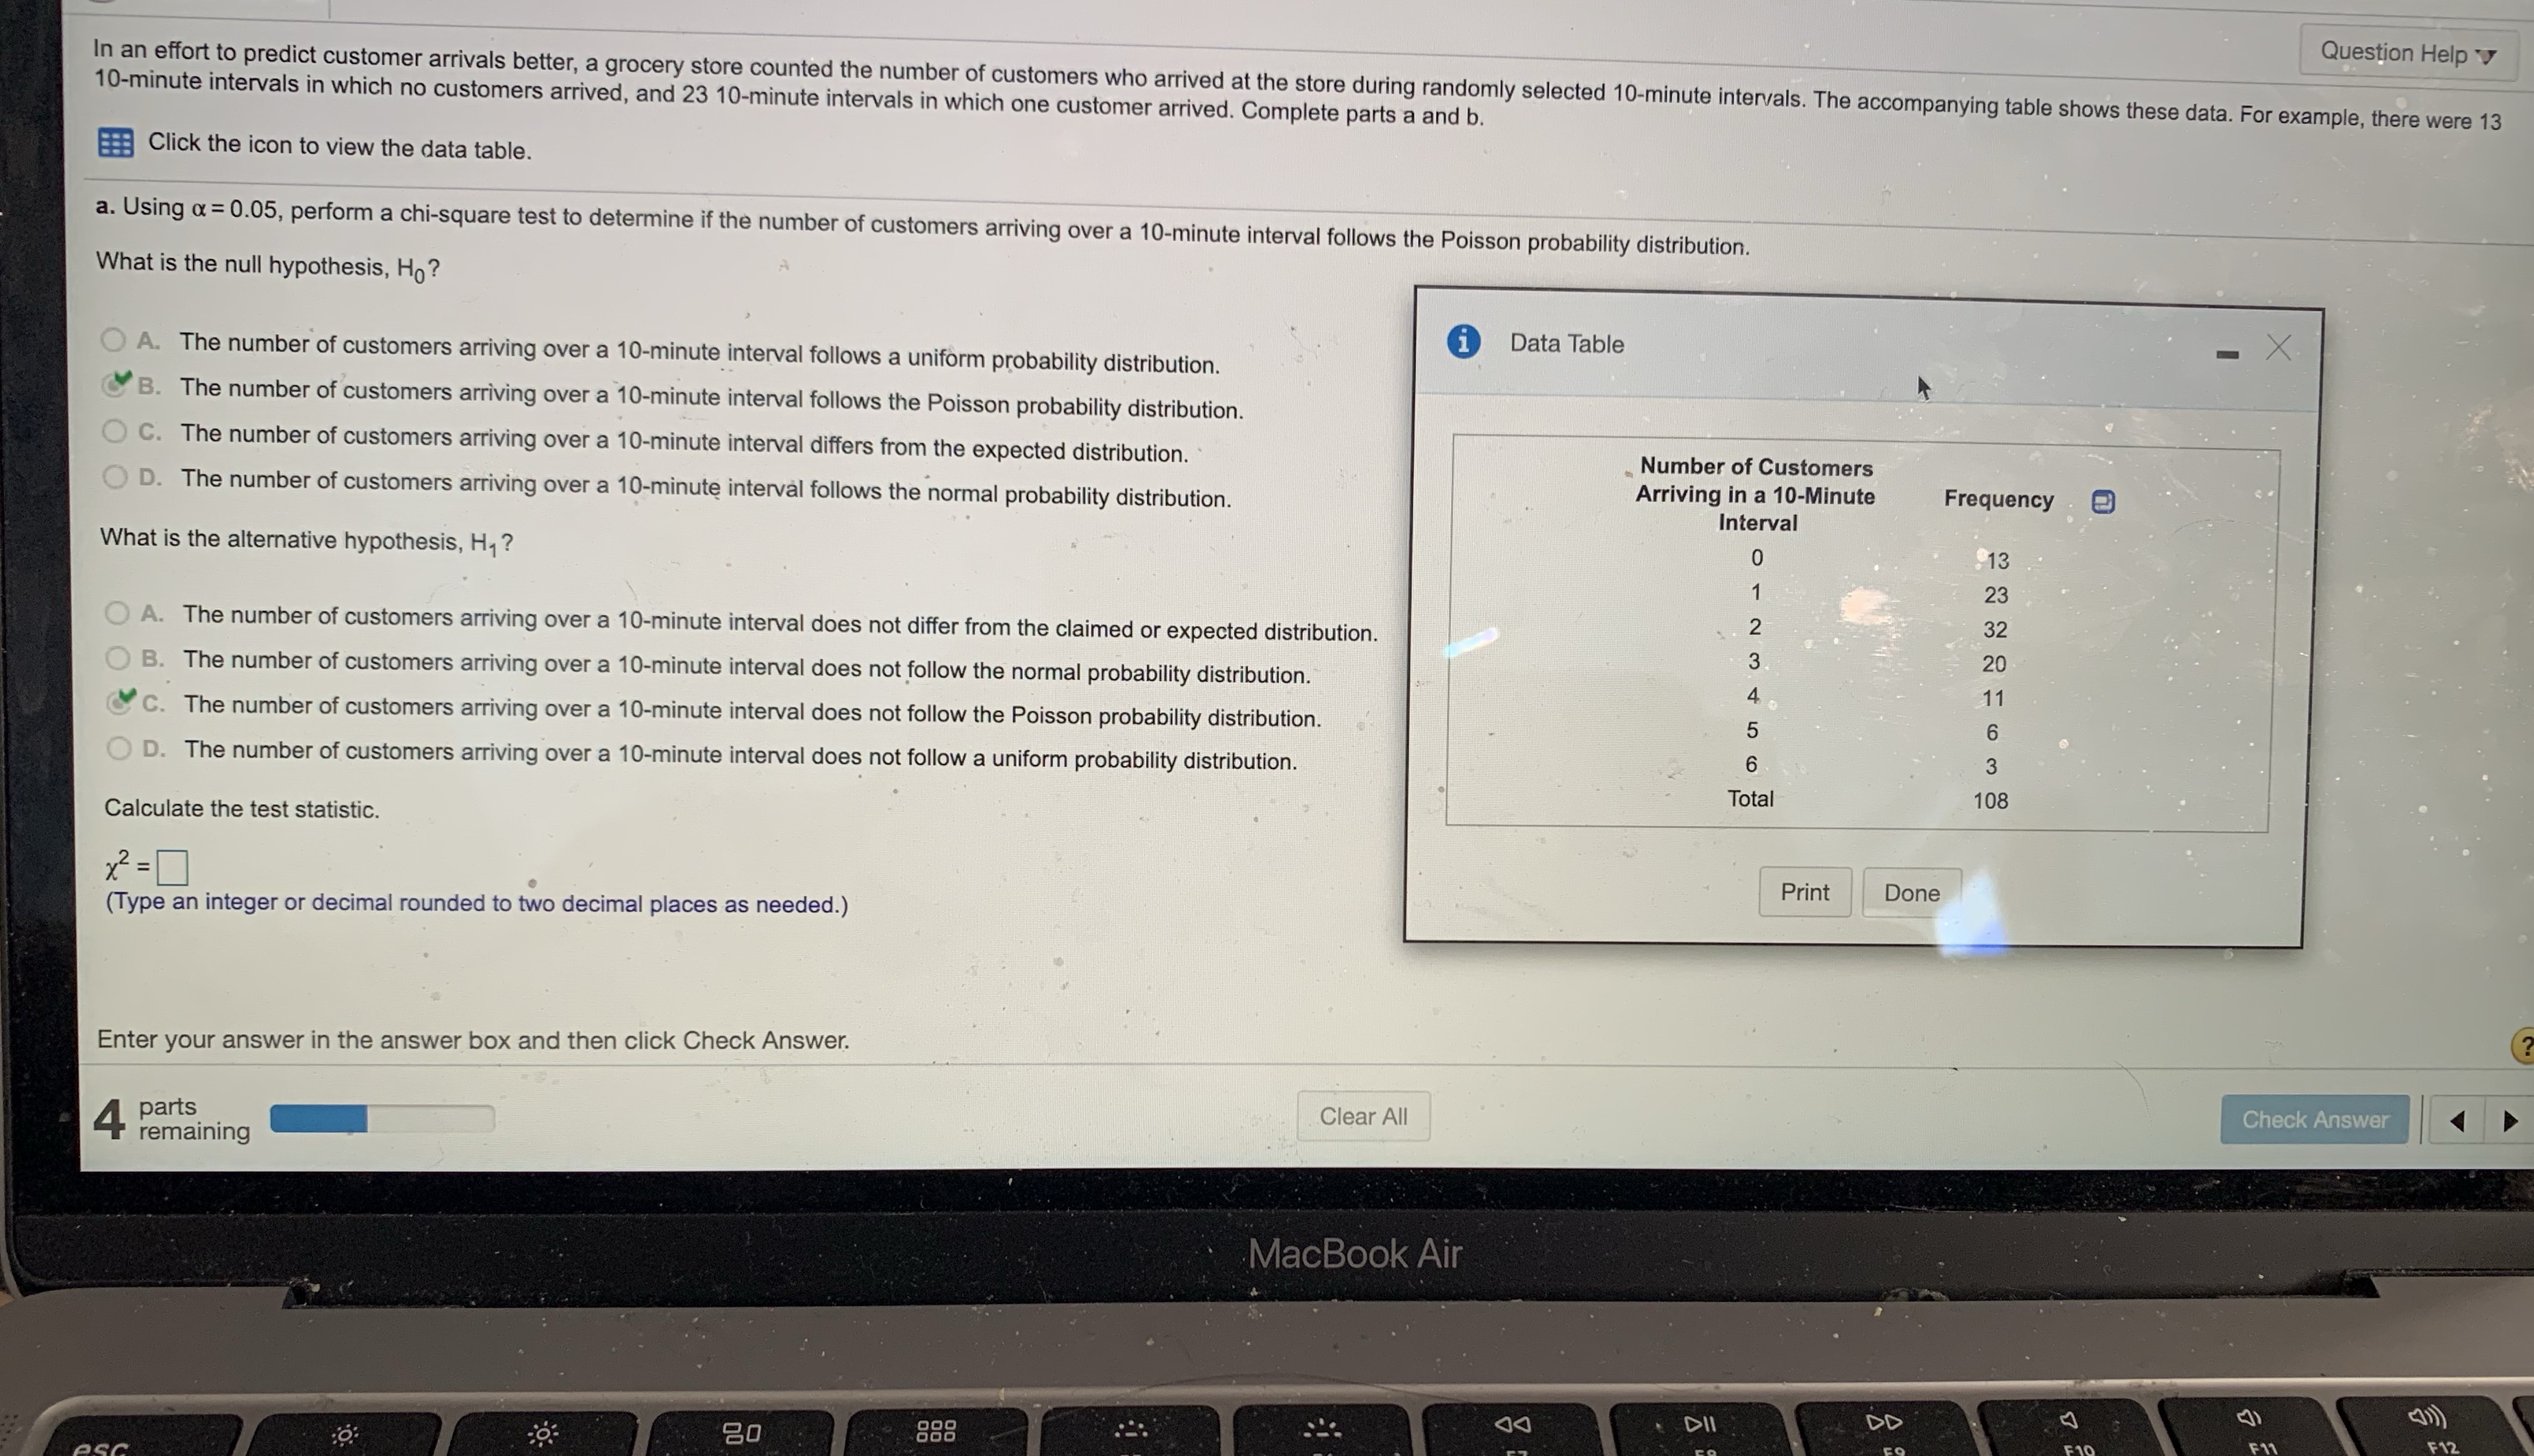
C. Determine the critical value X2a= type in integer or decimal rounded to two decimal places as needed. D. Since x2 ___ x2a ______ the null hypothesis. Based on the results it ____ reasonable to assume the number of customers arriving over a 10 minute interval does not follow the ______ E. Determine the P value type in integer or decimal rounded to three decimal places as needed.F. At x=0.10 the p value is ____ than x so ____ the null hypothesis. There is ____ evidence to conclude that the population distribution of number of customers arriving does not follow the______
Step by Step Solution
There are 3 Steps involved in it
Step: 1

Get Instant Access to Expert-Tailored Solutions
See step-by-step solutions with expert insights and AI powered tools for academic success
Step: 2

Step: 3
Ace Your Homework with AI
Get the answers you need in no time with our AI-driven, step-by-step assistance
Get Started
An Introduction to the Mathematics of financial Derivatives
Authors: Salih N. Neftci
2nd Edition
978-0125153928, 9780080478647, 125153929, 978-0123846822