Answered step by step
Verified Expert Solution
Question
1 Approved Answer
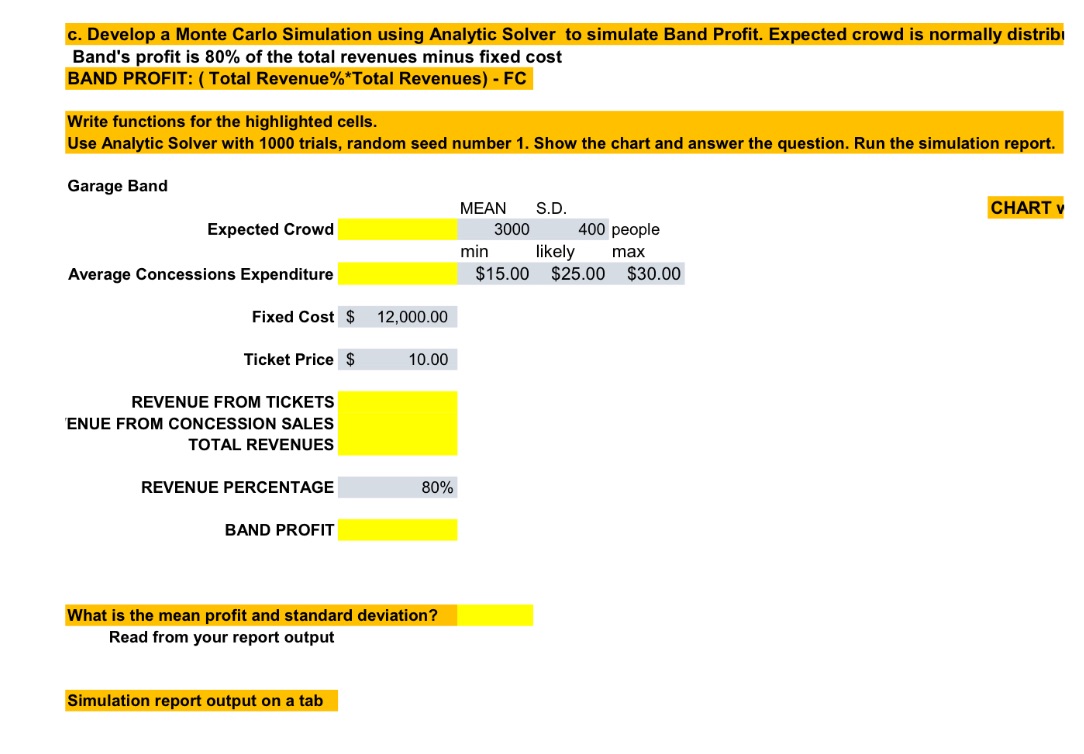
c. Develop a Monte Carlo Simulation using Analytic Solver to simulate Band Profit. Expected crowd is normally distributed with a mean of 3000 and standard
| c. Develop a Monte Carlo Simulation using Analytic Solver to simulate Band Profit. Expected crowd is normally distributed with a mean of 3000 and standard deviation of 400. Avg Concesions Sales is distributed with a Triangular Distribution | |||||||||||||||||||||||||
| Band's profit is 80% of the total revenues minus fixed cost | |||||||||||||||||||||||||
| BAND PROFIT: ( Total Revenue%*Total Revenues) - FC | |||||||||||||||||||||||||
| Write functions for the highlighted cells. | |||||||||||||||||||||||||
| Use Analytic Solver with 1000 trials, random seed number 1. Show the chart and answer the question. Run the simulation report. | |||||||||||||||||||||||||
| Garage Band | |||||||||||||||||||||||||
| MEAN | S.D. | CHART within the Report or separately | |||||||||||||||||||||||
| Expected Crowd | 3000 | 400 | people | ||||||||||||||||||||||
| min | likely | max | |||||||||||||||||||||||
| Average Concessions Expenditure | $15.00 | $25.00 | $30.00 | ||||||||||||||||||||||
| Fixed Cost | $12,000.00 | ||||||||||||||||||||||||
| Ticket Price | $10.00 | ||||||||||||||||||||||||
| REVENUE FROM TICKETS | |||||||||||||||||||||||||
| REVENUE FROM CONCESSION SALES | |||||||||||||||||||||||||
| TOTAL REVENUES | |||||||||||||||||||||||||
| REVENUE PERCENTAGE | 80% | ||||||||||||||||||||||||
| BAND PROFIT | |||||||||||||||||||||||||
| What is the mean profit and standard deviation? | |||||||||||||||||||||||||
| Read from your report output | |||||||||||||||||||||||||
| Simulation report output on a tab |

c. Develop a Monte Carlo Simulation using Analytic Solver to simulate Band Profit. Expected crowd is normally distrib Band's profit is 80% of the total revenues minus fixed cost BAND PROFIT: (Total Revenue %*Total Revenues) - FC Write functions for the highlighted cells. Use Analytic Solver with 1000 trials, random seed number 1. Show the chart and answer the question. Run the simulation report. Garage Band Expected Crowd Average Concessions Expenditure Fixed Cost $ 12,000.00 Ticket Price $ 10.00 REVENUE FROM TICKETS ENUE FROM CONCESSION SALES TOTAL REVENUES REVENUE PERCENTAGE BAND PROFIT 80% What is the mean profit and standard deviation? Read from your report output Simulation report output on a tab MEAN S.D. 3000 400 people min likely max $15.00 $25.00 $30.00 CHART v
Step by Step Solution
★★★★★
3.37 Rating (150 Votes )
There are 3 Steps involved in it
Step: 1
first lets define the functions for the highlighted cells Function for Total Revenue SUMIFSBB AA Gar...
Get Instant Access to Expert-Tailored Solutions
See step-by-step solutions with expert insights and AI powered tools for academic success
Step: 2

Step: 3

Ace Your Homework with AI
Get the answers you need in no time with our AI-driven, step-by-step assistance
Get Started


