

Question
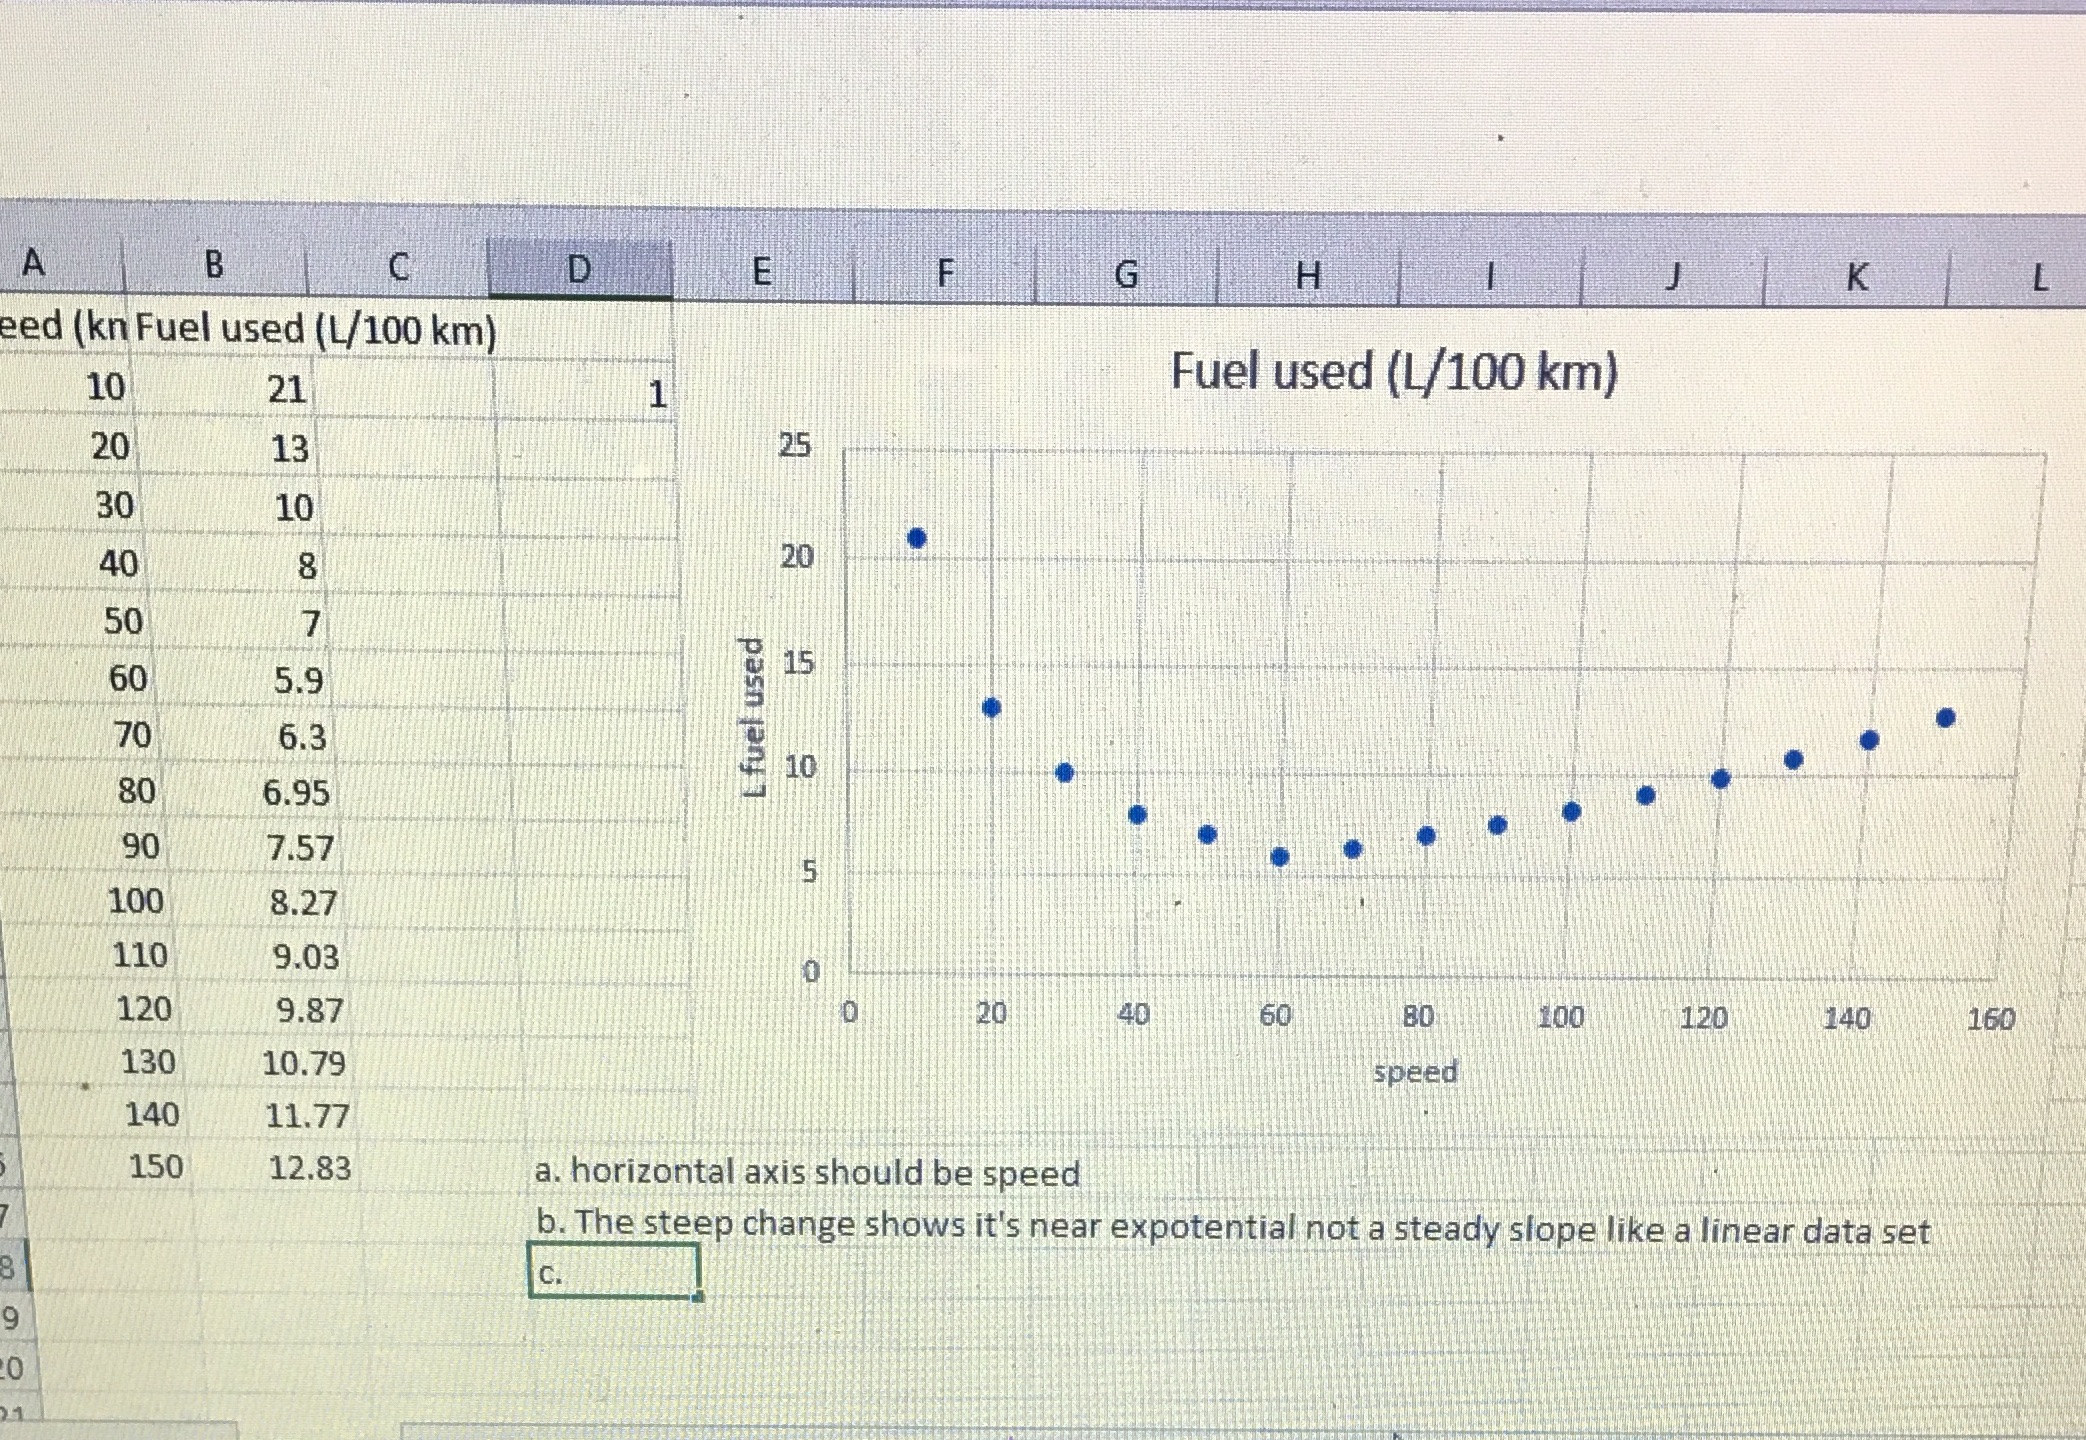
C. It doesn't make sense to describe data as positive or negative associations why?Is the relationship weak or strong? Explain To back up the data
C. It doesn't make sense to describe data as positive or negative associations why?Is the relationship weak or strong? Explain To back up the data find the correlation of r for the data r and R2 are different data
Step by Step Solution
There are 3 Steps involved in it
Step: 1

Get Instant Access to Expert-Tailored Solutions
See step-by-step solutions with expert insights and AI powered tools for academic success
Step: 2

Step: 3
Ace Your Homework with AI
Get the answers you need in no time with our AI-driven, step-by-step assistance
Get Started
Mathematical Applications For The Management, Life And Social Sciences
Authors: Ronald J. Harshbarger, James J. Reynolds
12th Edition
978-1337625340