Question
C++ PROGRAMMING LANGUAGE ONLY Read in txt file: 51 California 39144818 55 Texas 27469114 38 Florida 20271272 29 New_York 19795791 29 Illinois 12859995 20 Pennsylvania

C++ PROGRAMMING LANGUAGE ONLY
Read in txt file:
51 California 39144818 55 Texas 27469114 38 Florida 20271272 29 New_York 19795791 29 Illinois 12859995 20 Pennsylvania 12802503 20 Ohio 11613423 18 Georgia 10214860 16 North_Carolina 10042802 15 Michigan 9922576 16 New_Jersey 8958013 14 Virginia 8382993 13 Washington 7170351 12 Arizona 6828065 11 Massachusetts 6794422 11 Indiana 6619680 11 Tennessee 6600299 11 Missouri 6083672 10 Maryland 6006401 10 Wisconsin 5771337 10 Minnesota 5489594 10 Colorado 5456574 9 South_Carolina 4896146 9 Alabama 4858979 9 Louisiana 4670724 8 Kentucky 4425092 8 Oregon 4028977 7 Oklahoma 3911338 7 Connecticut 3590886 7 Iowa 3123899 6 Utah 2995919 6 Mississippi 2992333 6 Arkansas 2978204 6 Kansas 2911641 6 Nevada 2890845 6 New_Mexico 2085109 5 Nebraska 1896190 5 West_Virginia 1844128 5 Idaho 1654930 4 Hawaii 1431603 4 New_Hampshire 1330608 4 Maine 1329328 4 Rhode_Island 1056298 4 Montana 1032949 3 Delaware 945934 3 South_Dakota 858469 3 North_Dakota 756927 3 Alaska 738432 3 Washington_DC 672228 3 Vermont 626042 3 Wyoming 586107 3
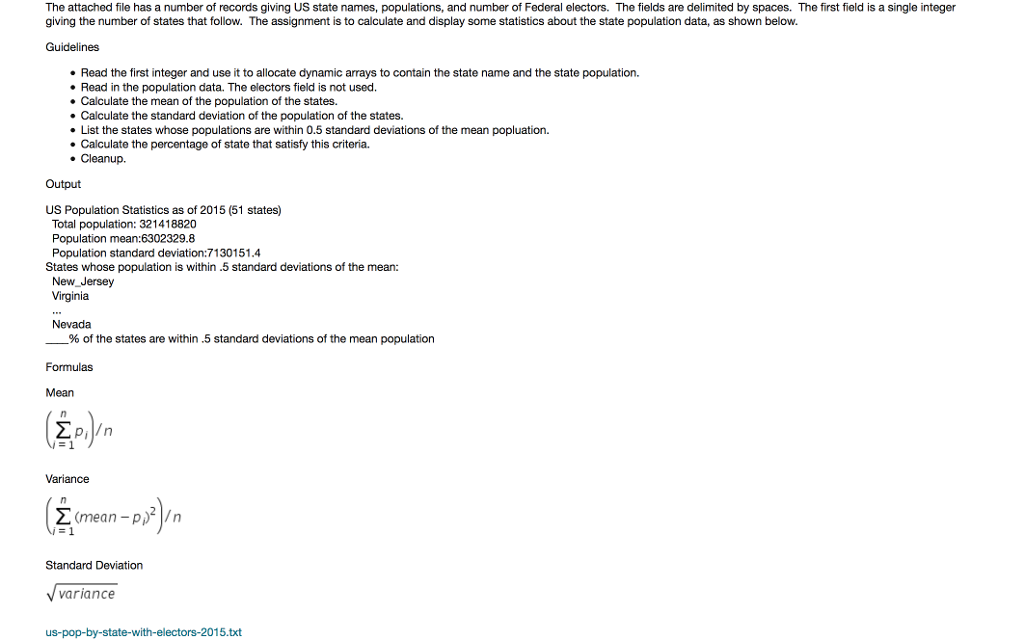
The attached file has a number of records giving US state names, populations, and number of Federal electors. The fields are delimited by spaces. The first field is a single integer giving the number of states that follow. The assignment is to calculate and display some statistics about the state population data, as shown below. Guidelines Read the first integer and use it to allocate dynamic arrays to contain the state name and the state population. Read in the population data. The electors field is not used. Calculate the mean of the population of the states. Calculate the standard deviation of the population of the states. List the states whose populations are within 0.5 standard deviations of the mean popluation. Calculate the percentage of state that satisfy this criteria. Cleanup Output US Population Statistics as of 2015 (51 states) Total population: 321418820 Population mean:6302329.8 Population standard deviation: 7130151.4 States whose population is within .5 standard deviations ofthe mean: New Jersey Virginia Nevada of the states are within 5 standard deviations of the mean population Formulas Mean Variance (mean -p Standard Deviation variance us-pop-by-state-with-electors-2015.txt The attached file has a number of records giving US state names, populations, and number of Federal electors. The fields are delimited by spaces. The first field is a single integer giving the number of states that follow. The assignment is to calculate and display some statistics about the state population data, as shown below. Guidelines Read the first integer and use it to allocate dynamic arrays to contain the state name and the state population. Read in the population data. The electors field is not used. Calculate the mean of the population of the states. Calculate the standard deviation of the population of the states. List the states whose populations are within 0.5 standard deviations of the mean popluation. Calculate the percentage of state that satisfy this criteria. Cleanup Output US Population Statistics as of 2015 (51 states) Total population: 321418820 Population mean:6302329.8 Population standard deviation: 7130151.4 States whose population is within .5 standard deviations ofthe mean: New Jersey Virginia Nevada of the states are within 5 standard deviations of the mean population Formulas Mean Variance (mean -p Standard Deviation variance us-pop-by-state-with-electors-2015.txtStep by Step Solution
There are 3 Steps involved in it
Step: 1

Get Instant Access to Expert-Tailored Solutions
See step-by-step solutions with expert insights and AI powered tools for academic success
Step: 2

Step: 3

Ace Your Homework with AI
Get the answers you need in no time with our AI-driven, step-by-step assistance
Get Started


