Answered step by step
Verified Expert Solution
Question
1 Approved Answer
C. Station Model At airports and other manned stations/point of observation throughout the country the weather is observed, measured and recorded. These stations record:
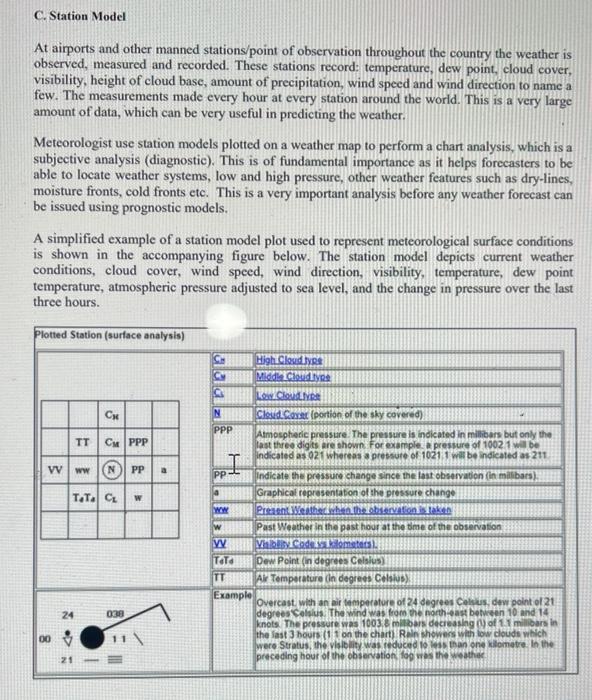
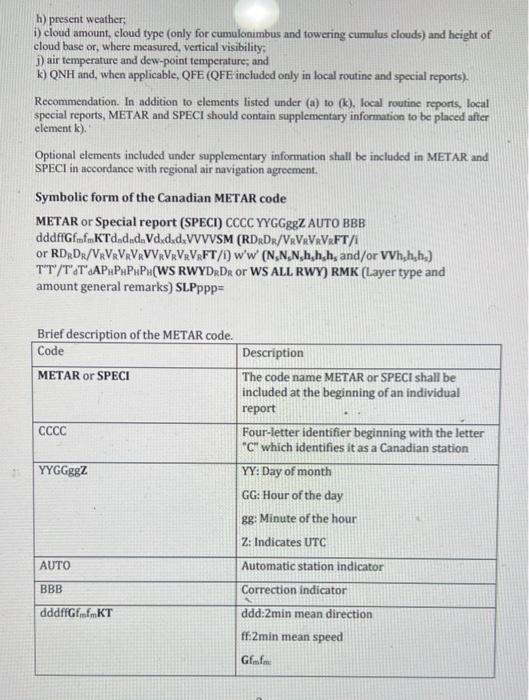
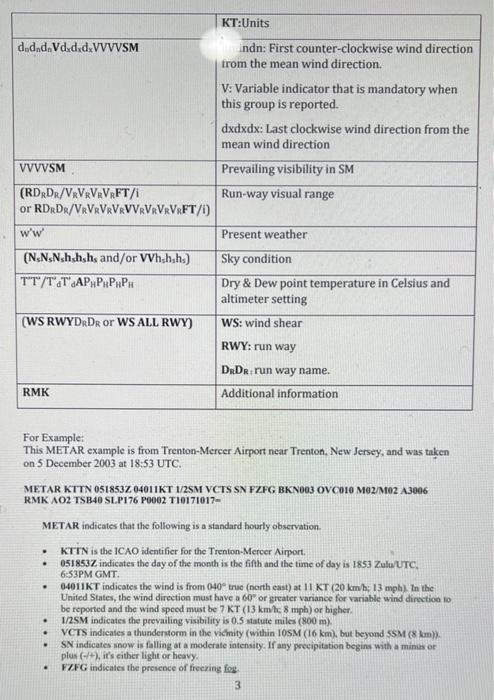
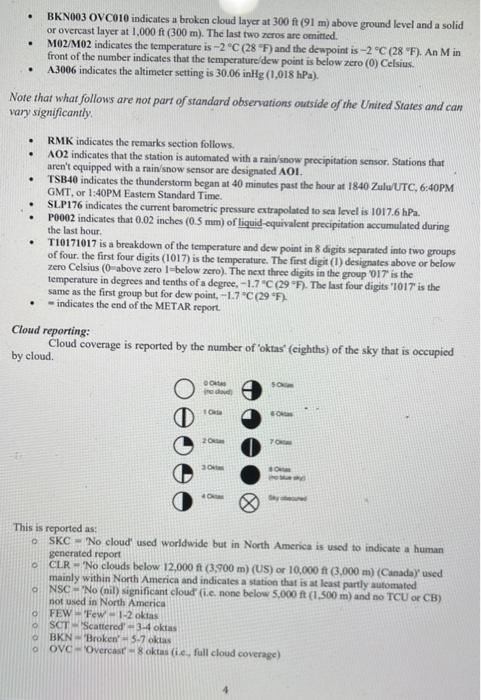
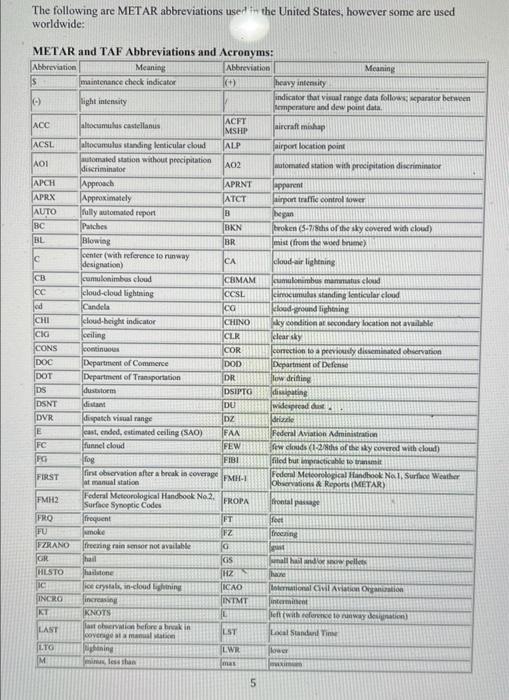
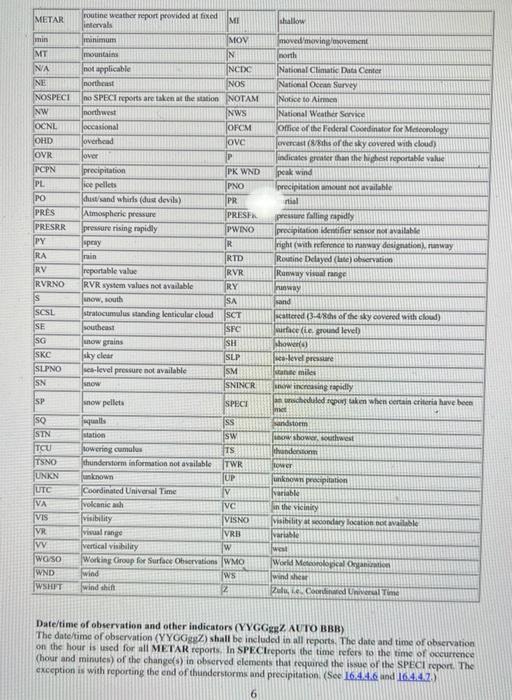
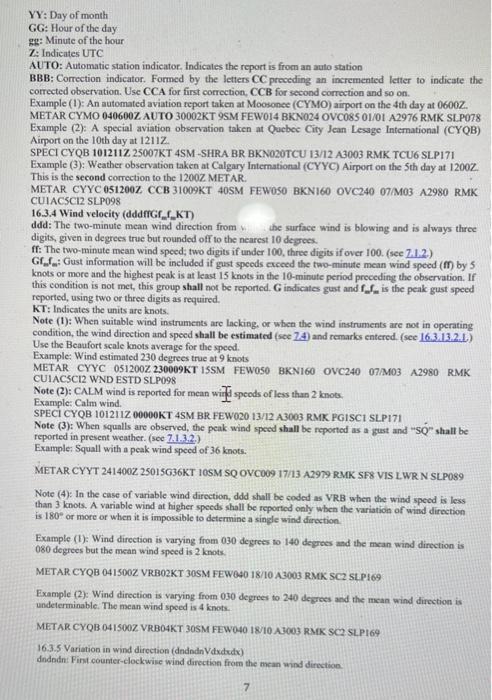
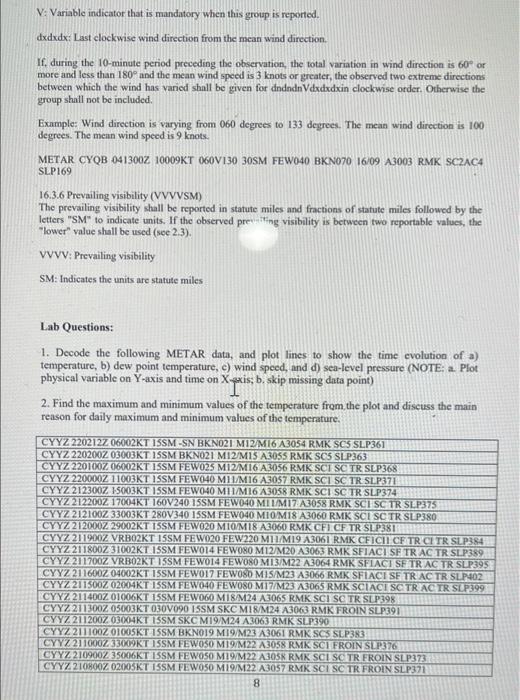
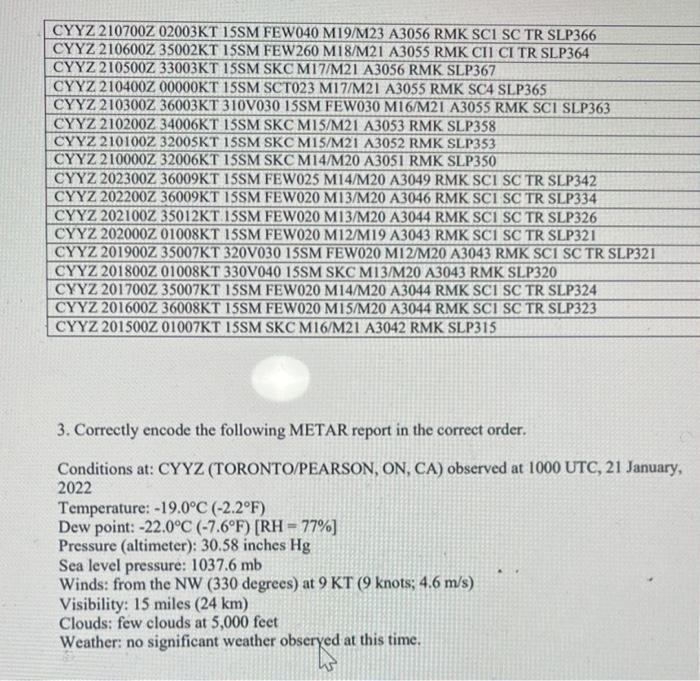
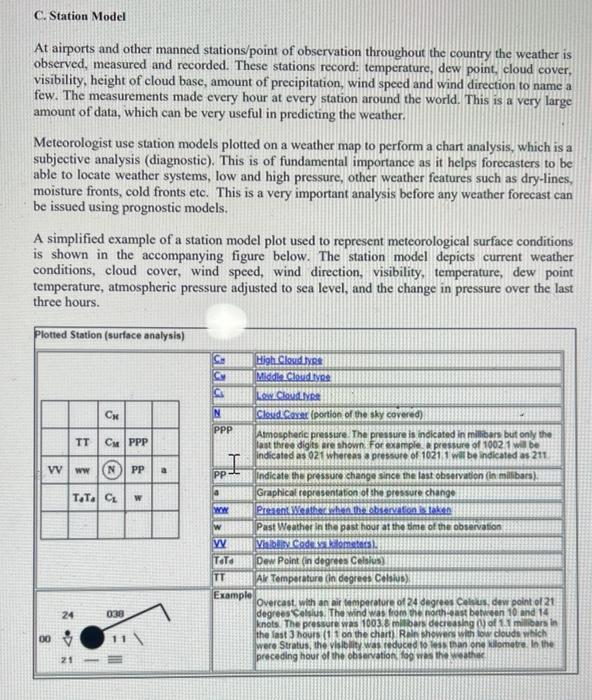
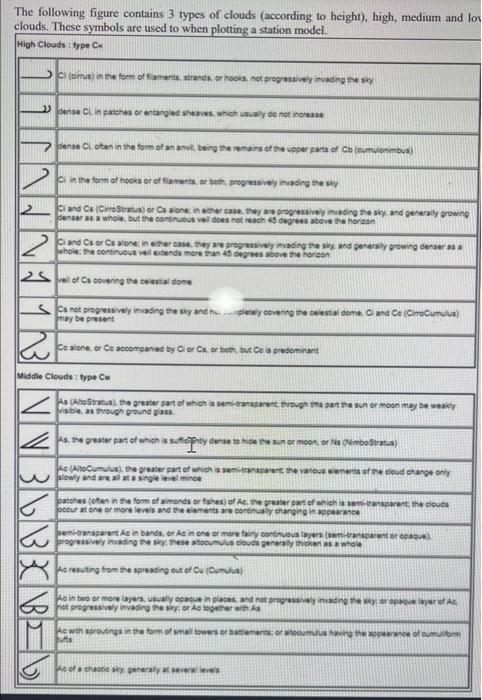
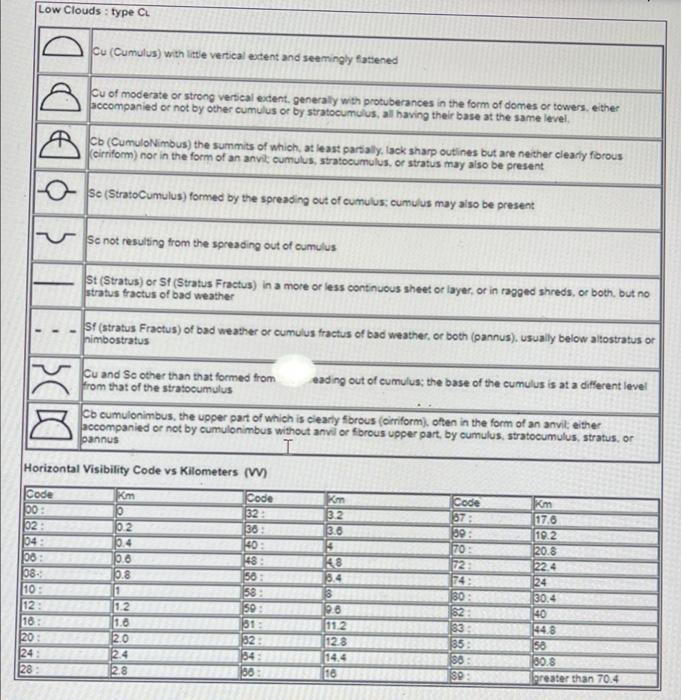
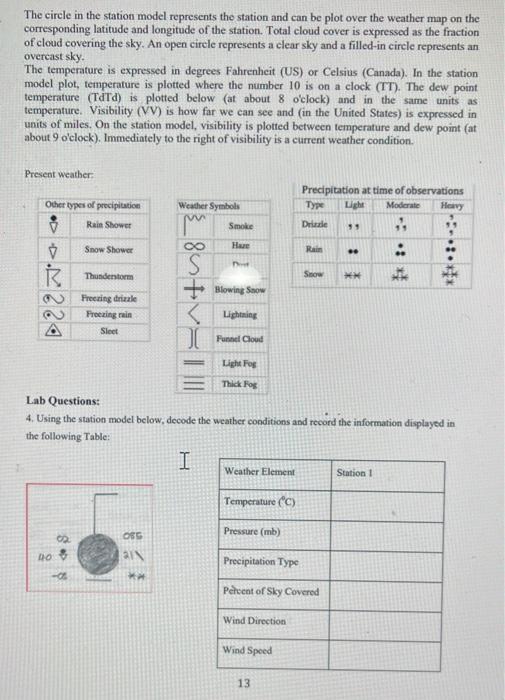
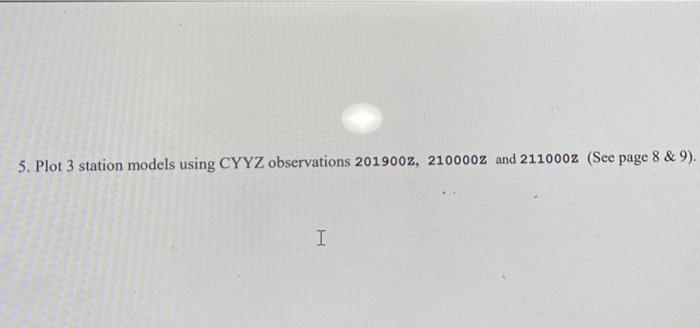
C. Station Model At airports and other manned stations/point of observation throughout the country the weather is observed, measured and recorded. These stations record: temperature, dew point, cloud cover, visibility, height of cloud base, amount of precipitation, wind speed and wind direction to name a few. The measurements made every hour at every station around the world. This is a very large amount of data, which can be very useful in predicting the weather. Meteorologist use station models plotted on a weather map to perform a chart analysis, which is a subjective analysis (diagnostic). This is of fundamental importance as it helps forecasters to be able to locate weather systems, low and high pressure, other weather features such as dry-lines, moisture fronts, cold fronts etc. This is a very important analysis before any weather forecast can be issued using prognostic models. A simplified example of a station model plot used to represent meteorological surface conditions is shown in the accompanying figure below. The station model depicts current weather conditions, cloud cover, wind speed, wind direction, visibility, temperature, dew point temperature, atmospheric pressure adjusted to sea level, and the change in pressure over the last three hours. Plotted Station (surface analysis) PPP VV ww NPP a 00 TaTa C 24 TT 21 038 W PPP PP H ww W VV TaTa TT Example High Cloud type Middle Cloud type Low Cloudtyp Cloud Cover (portion of the sky covered) Atmospheric pressure. The pressure is indicated in millibars but only the last three digits are shown. For example, a pressure of 1002 1 will be indicated as 021 whereas a pressure of 1021.1 will be indicated as 211 Indicate the pressure change since the last observation (in millibars). Graphical representation of the pressure change Present Weather when the observation is taken Past Weather in the past hour at the time of the observation Valollity Code is kilometers Dew Point (in degrees Celsius) Air Temperature (in degrees Celsius) Overcast, with an air temperature of 24 degrees Celsius, dew point of 21 degrees Celsius. The wind was from the north-east between 10 and 14 knots. The pressure was 1003.8 milibars decreasing (1) of 1.1 millibars in the last 3 hours (11 on the chart) Rain showers with low clouds which were Stratus, the visibility was reduced to less than one kilometre. In the preceding hour of the observation, fog was the h) present weather, i) cloud amount, cloud type (only for cumulonimbus and towering cumulus clouds) and height of cloud base or, where measured, vertical visibility; j) air temperature and dew-point temperature; and k) QNH and, when applicable, QFE (QFE included only in local routine and special reports). Recommendation. In addition to elements listed under (a) to (k), local routine reports, local special reports, METAR and SPECI should contain supplementary information to be placed after element k). Optional elements included under supplementary information shall be included in METAR and SPECI in accordance with regional air navigation agreement. Symbolic form of the Canadian METAR code METAR or Special report (SPECI) CCCC YYGGggZ AUTO BBB dddffGfmfmKTdadada Vd.d.d.VVVVSM (RDRDR/VRVRVRVRFT/i or RDRDR/VRVRVRVRVVRVRVRVRFT/i) w'w' (N,N,N,h,h,h, and/or VVh,h,h,) TT/T&T&APHPHPHPH(WS RWYDRDR or WS ALL RWY) RMK (Layer type and amount general remarks) SLPppp= Brief description of the METAR code. Code METAR or SPECI CCCC YYGGggZ AUTO BBB dddffGfmfmKT Description The code name METAR or SPECI shall be included at the beginning of an individual report Four-letter identifier beginning with the letter "C" which identifies it as a Canadian station YY: Day of month GG: Hour of the day gg: Minute of the hour Z: Indicates UTC Automatic station indicator Correction indicator ddd:2min mean direction. ff:2min mean speed Gfmf dadad VdxdxdxVVVVSM VVVVSM (RDRDR/VRVRVRVRFT/i or RDRDR/VRVRVRVRVVRVRVRVRFT/I) W'W' (N.N.Nshshshs and/or VVhshshs) TT/T&T APPHPPH (WS RWYDRDR or WS ALL RWY) RMK . . For Example: This METAR example is from Trenton-Mercer Airport near Trenton, New Jersey, and was taken on 5 December 2003 at 18:53 UTC. . METAR KTTN 0518532, 04011KT 1/2SM VCTS SN FZFG BKN003 OVC010 M02/M02 A3006 RMK A02 TSB40 SLP176 P0002 T10171017- . KT:Units indn: First counter-clockwise wind direction from the mean wind direction. METAR indicates that the following is a standard hourly observation. KTTN is the ICAO identifier for the Trenton-Mercer Airport. 0518537 indicates the day of the month is the fifth and the time of day is 1853 Zulu/UTC. 6:53PM GMT. . V: Variable indicator that is mandatory when this group is reported. . dxdxdx: Last clockwise wind direction from the mean wind direction . Prevailing visibility in SM Run-way visual range Present weather Sky condition Dry & Dew point temperature in Celsius and altimeter setting WS: wind shear RWY: run way DRDR: run way name. Additional information 04011KT indicates the wind is from 040 truc (north east) at 11 KT (20 km/h; 13 mph). In the United States, the wind direction must have a 60" or greater variance for variable wind direction to be reported and the wind speed must be 7 KT (13 km/h: 8 mph) or higher. 1/2SM indicates the prevailing visibility is 0.5 statute miles (800 m). VCTS indicates a thunderstorm in the vicinity (within 10SM (16 km), but beyond SSM (8 km)). SN indicates snow is falling at a moderate intensity. If any precipitation begins with a minus or plus (-/+), it's either light or heavy. FZFG indicates the presence of freezing fog 3 . . Note that what follows are not part of standard observations outside of the United States and can vary significantly . . RMK indicates the remarks section follows. A02 indicates that the station is automated with a rain/snow precipitation sensor. Stations that aren't equipped with a rain/snow sensor are designated AOL. . . . . BKN003 OVC010 indicates a broken cloud layer at 300 ft (91 m) above ground level and a solid or overcast layer at 1,000 ft (300 m). The last two zeros are omitted. M02/M02 indicates the temperature is -2 C (28 "F) and the dewpoint is -2 C (28 "F). An M in front of the number indicates that the temperature/dew point is below zero (0) Celsius. A3006 indicates the altimeter setting is 30.06 inHg (1,018 hPa). O 9 TSB40 indicates the thunderstorm began at 40 minutes past the hour at 1840 Zulu/UTC, 6:40PM GMT, or 1:40PM Eastern Standard Time. SLP176 indicates the current barometric pressure extrapolated to sea level is 1017.6 hPa. P0002 indicates that 0.02 inches (0.5 mm) of liquid-equivalent precipitation accumulated during the last hour. Cloud reporting: Cloud coverage is reported by the number of 'oktas' (eighths) of the sky that is occupied by cloud. T10171017 is a breakdown of the temperature and dew point in 8 digits separated into two groups of four, the first four digits (1017) is the temperature. The first digit (1) designates above or below zero Celsius (0-above zero 1-below zero). The next three digits in the group 017 is the temperature in degrees and tenths of a degree, -1.7 C (29 F). The last four digits '1017' is the same as the first group but for dew point. -1.7 C (29 F) -indicates the end of the METAR report. D Ok nedaud C O 30 Ok Schim This is reported as: o SKC No cloud' used worldwide but in North America is used to indicate a human generated report CLR- No clouds below 12,000 ft (3,900 m) (US) or 10,000 ft (3,000 m) (Canada) used mainly within North America and indicates a station that is at least partly automated NSC No (nil) significant cloud (i.e. none below 5,000 ft (1.500 m) and no TCU or CB) not used in North America O FEW-Few-1-2 oktas O SCT-Scattered-3-4 oktas O BKN-Broken-5-7 oktas O OVC-Overcast-8 oktas (ie, full cloud coverage) word The following are METAR abbreviations used in the United States, however some are used worldwide: METAR and TAF Abbreviations and Acronyms: Abbreviation Abbreviation (+) S ACC ACSL A01 APCH APRX AUTO BC BL C CB od CHI CIG CONS DOC DOT DS DSNT DVR E FC FG FIRST FMH2 FRO FU FZRANO GR HLSTO DC INCRO KT LAST LTG M Meaning maintenance check indicator light intensity altocumulus castellanus altocumulus standing lenticular cloud automated station without precipitation discriminator Approach Approximately fully automated report Patches Blowing center (with reference to runway designation) cumulonimbus cloud cloud-cloud lightning Candela cloud-height indicator ceiling continuous Department of Commerce Department of Transportation duststorm distant dispatch visual range east, ended, estimated ceiling (SAO) funnel cloud fog first observation after a break in coverage at manual station Federal Meteorological Handbook No.2, Surface Synoptic Codes frequent moke freezing rain sensor not available hail hailstone ice crystals, in-cloud lightning increasing KNOTS Jast observation before a break in coverage at a manual station igining mimas, less than ACFT MSHP ALP A02 APRNT ATCT B BKN BR CA CBMAM CCSL co CHINO CLR COR DOD DR DSIPTO DU DZ FAA FEW FIBI FMH-1 FROPA FT FZ G GS HZ ICAO INTMT L LST LWR mas 5 Meaning heavy intensity indicator that visual range data follows; separator between temperature and dew point data. aircraft mishap airport location point automated station with precipitation discriminator apparent airport traffic control tower began broken (5-7/8ths of the sky covered with cloud) mist (from the word brume) cloud-air lightning cumulonimbus mammatus cloud cirrocumubas standing lenticular cloud cloud-ground lightning ky condition at secondary location not available clear sky correction to a previously disseminated observation Department of Defense low drifting dissipating widespread dust drizzle Federal Aviation Administration few clouds (1-2/8ths of the sky covered with cloud) filed but impracticable to transmit Federal Meteorological Handbook No.1, Surface Weather Observations & Reports (METAR) frontal passage feet freezing beast small hail and or snow pellets haze International Civil Aviation Organization intermitent left (with reference to runway designation) Local Standard Time Arwer METAR min MT NA NE NOSPECI NW OCNI OHD OVR PCPN PL PO PRES PRESRR PY RA RV RVRNO s SCSL SE SG SKC SLPNO SN SP SQ STN TCU TSNO UNKN UTC VA VIS VR VV WOSO WND WSHFT routine weather report provided at fixed intervals minimum mountains not applicable NCDC northeast NOS no SPECI reports are taken at the station NOTAM northwest occasional overhead over precipitation ice pellets dust/sand whirls (dust devils) Atmospheric pressure pressure rising rapidly spray rain reportable value RVR system values not available snow, south stratocumulus standing lenticular cloud southeast snow grains sky clear sea-level pressure not available snow snow pellets qualle station towering cumulus thunderstorm information not available ME MOV N unknown Coordinated Universal Time NWS OFCM ove P PK WND PNO PR PRESEK PWINO R RTD RVR RY SA SCT SFC SH SLP SM SNINCR SPECI SS sw TS TWR UP V VC volcanic ash visibility VISNO visual range VRB vertical visibility W Working Group for Surface Observations WMO wind ws wind shift 2 shallow moved moving/movement north National Climatic Data Center National Ocean Survey Notice to Airmen National Weather Service Office of the Federal Coordinator for Meteorology overcast (8/8ths of the sky covered with cloud) indicates greater than the highest reportable value peak wind precipitation amount not available rtial pressure falling rapidly precipitation identifier sensor not available right (with reference to runway designation), runway Routine Delayed (late) observation Runway visual range runway sand scattered (3-4/8ths of the sky covered with cloud) surface (Le ground level) shower(s) sea-level pressure stante miles snow increasing rapidly an unscheduled report taken when certain criteria have been met sandstorm shower, southwest thandentonn tower unknown precipitation variable in the vicinity visibility at secondary location not available variable west World Meteorological Organization wind shear Zulu, Le Coordinated Universal Time Date/time of observation and other indicators (YYGGERZ AUTO BBB) The date/time of observation (YYGGggZ) shall be included in all reports. The date and time of observation on the hour is used for all METAR reports. In SPECIreports the time refers to the time of occurrence (hour and minutes) of the change(s) in observed elements that required the issue of the SPECI report. The exception is with reporting the end of thunderstorms and precipitation. (See 16.4.4.6 and 16.4.4.2.) 6 YY: Day of month GG: Hour of the day gg: Minute of the hour Z: Indicates UTC AUTO: Automatic station indicator. Indicates the report is from an auto station BBB: Correction indicator. Formed by the letters CC preceding an incremented letter to indicate the corrected observation. Use CCA for first correction, CCB for second correction and so on. Example (1): An automated aviation report taken at Moosonce (CYMO) airport on the 4th day at 0600Z. METAR CYMO 040600Z AUTO 30002KT 9SM FEW014 BKN024 OVC085 01/01 A2976 RMK SLP078 Example (2): A special aviation observation taken at Quebec City Jean Lesage International (CYQB) Airport on the 10th day at 12112. SPECI CYQB 101211Z 25007KT 4SM-SHRA BR BKN020TCU 13/12 A3003 RMK TCU6 SLP171 Example (3): Weather observation taken at Calgary International (CYYC) Airport on the 5th day at 12002. This is the second correction to the 1200Z METAR. METAR CYYC 051200Z CCB 31009KT 40SM FEW050 BKN160 OVC240 07/M03 A2980 RMK CUIACSC12 SLP098 16.3.4 Wind velocity (dddffGf_f_KT) the surface wind is blowing and is always three ddd: The two-minute mean wind direction from digits, given in degrees true but rounded off to the nearest 10 degrees. ff: The two-minute mean wind speed; two digits if under 100, three digits if over 100. (see 7.1.2) Gff: Gust information will be included if gust speeds exceed the two-minute mean wind speed (ff) by 5 knots or more and the highest peak is at least 15 knots in the 10-minute period preceding the observation. If this condition is not met, this group shall not be reported. G indicates gust and ff is the peak gust speed reported, using two or three digits as required. KT: Indicates the units are knots. Note (1): When suitable wind instruments are lacking, or when the wind instruments are not in operating condition, the wind direction and speed shall be estimated (see 7.4) and remarks entered. (see 16.3.13.2.1) Use the Beaufort scale knots average for the speed. Example: Wind estimated 230 degrees true at 9 knots METAR CYYC 051200Z 230009KT 15SM FEW050 BKN160 OVC240 07/M03 A2980 RMK CULACSC12 WND ESTD SLP098 Note (2): CALM wind is reported for mean wird speeds of less than 2 knots. wit Example: Calm wind. SPECI CYQB 101211Z 00000KT 4SM BR FEW020 13/12 A3003 RMK PGISCI SLP171 Note (3): When squalls are observed, the peak wind speed shall be reported as a gust and "SQ" shall be reported in present weather. (see 7.1.3.2.) Example: Squall with a peak wind speed of 36 knots. METAR CYYT 2414002 25015036KT 10SM SQ OVC009 17/13 A2979 RMK SFS VIS LWR N SLP089 Note (4): In the case of variable wind direction, ddd shall be coded as VRB when the wind speed is less than 3 knots. A variable wind at higher speeds shall be reported only when the variation of wind direction is 180 or more or when it is impossible to determine a single wind direction. Example (1): Wind direction is varying from 030 degrees to 140 degrees and the mean wind direction is 080 degrees but the mean wind speed is 2 knots. METAR CYQB 0415002 VRB02KT 30SM FEW040 18/10 A3003 RMK SC2 SLP169 Example (2): Wind direction is varying from 030 degrees to 240 degrees and the mean wind direction is undeterminable. The mean wind speed is 4 knots. METAR CYQB 041500Z VRB04KT 30SM FEW040 18/10 A3003 RMK SC2 SLP169 16.3.5 Variation in wind direction (dndndnVdxdxdx) dndndn: First counter-clockwise wind direction from the mean wind direction. V: Variable indicator that is mandatory when this group is reported. dxdxdx: Last clockwise wind direction from the mean wind direction. If, during the 10-minute period preceding the observation, the total variation in wind direction is 60 or more and less than 180 and the mean wind speed is 3 knots or greater, the observed two extreme directions between which the wind has varied shall be given for dndndnVdxdxdxin clockwise order. Otherwise the group shall not be included. Example: Wind direction is varying from 060 degrees to 133 degrees. The mean wind direction is 100 degrees. The mean wind speed is 9 knots. METAR CYQB 041300Z 10009KT 060V130 30SM FEW040 BKN070 16/09 A3003 RMK SC2AC4 SLP169 16.3.6 Prevailing visibility (VVVVSM) The prevailing visibility shall be reported in statute miles and fractions of statute miles followed by the letters "SM" to indicate units. If the observed preting visibility is between two reportable values, the "lower" value shall be used (see 2.3). VVVV: Prevailing visibility SM: Indicates the units are statute miles Lab Questions: 1. Decode the following METAR data, and plot lines to show the time evolution of a) temperature, b) dew point temperature, c) wind speed, and d) sea-level pressure (NOTE: a. Plot physical variable on Y-axis and time on X-axis; b. skip missing data point) 2. Find the maximum and minimum values of the temperature from the plot and discuss the main reason for daily maximum and minimum values of the temperature. CYYZ 220212Z 06002KT 15SM-SN BKN021 M12/M16 A3054 RMK SC5 SLP361 CYYZ 2202002 03003KT 15SM BKN021 M12/M15 A3055 RMK SC5 SLP363 CYYZ 2201002 06002KT 15SM FEW025 M12/M16 A3056 RMK SCI SC TR SLP368 CYYZ 220000Z 11003KT 15SM FEW040 M11/M16 A3057 RMK SCI SC TR SLP371 CYYZ 212300Z 15003KT 15SM FEW040 M11/M16 A3058 RMK SCI SC TR SLP374 CYYZ 2122002 17004KT 160V240 15SM FEW040 MIL/M17 A3058 RMK SCI SC TR SLP375 CYYZ 2121002 33003KT 280V340 15SM FEW040 MIO/M18 A3060 RMK SCI SC TR SLP380 CYYZ 212000Z 29002KT 15SM FEW020 M10/M18 A3060 RMK CFI CF TR SLP381 CYYZ 211900Z VRB02KT 15SM FEW020 FEW220 M11/M19 A3061 RMK CFICII CFTR CITR SLP384 CYYZ 2118002 31002KT 15SM FEW014 FEW080 M12/M20 A3063 RMK SFIACI SE TRAC TR SLP389 CYYZ 211700Z VRB02KT 15SM FEW014 FEW080 M13/M22 A3064 RMK SFLACI SE TRAC TR SLP395 CYYZ 2116002 04002KT 15SM FEW017 FEWO80 M15/M23 A3066 RMK SFIACI SE TR AC TR SLP402 CYYZ 2115002 02004KT 15SM FEW040 FEWO80 M17/M23 A3065 RMK SCIACI SC TR AC TR SLP399 CYYZ 2114002 01006KT 15SM FEW060 M18/M24 A3065 RMK SCI SC TR SLP398 CYYZ 2113002 05003KT 030V090 15SM SKC M18/M24 A3063 RMK FROIN SLP391 CYYZ 211200Z 03004KT 15SM SKC M19/M24 A3063 RMK SLP390 CYYZ 2111002 01005KT 15SM BKN019 M19/M23 A3061 RMK SCS SLP383 CYYZ 211000Z 33009KT 15SM FEWO50 M19/M22 A3058 RMK SCI FROIN SLP376 CYYZ 210900Z 35006KT 15SM FEWO50 M19/M22 A3058 RMK SCI SC TR FROIN SLP373 CYYZ 2108002 02005KT 15SM FEW050 M19/M22 A3057 RMK SCI SC TR FROIN SLP371 8 CYYZ 210700Z 02003KT 15SM FEW040 M19/M23 A3056 RMK SC1 SC TR SLP366 CYYZ 210600Z 35002KT 15SM FEW260 M18/M21 A3055 RMK CII CI TR SLP364 CYYZ 210500Z 33003KT 15SM SKC M17/M21 A3056 RMK SLP367 CYYZ 2104002 00000KT 15SM SCT023 M17/M21 A3055 RMK SC4 SLP365 CYYZ 210300Z 36003KT 310V030 15SM FEW030 M16/M21 A3055 RMK SCI SLP363 CYYZ 210200Z 34006KT 15SM SKC M15/M21 A3053 RMK SLP358 CYYZ 2101002 3200SKT 15SM SKC M15/M21 A3052 RMK SLP353 CYYZ 210000Z 32006KT 15SM SKC M14/M20 A3051 RMK SLP350 CYYZ 202300Z 36009KT 15SM FEW025 M14/M20 A3049 RMK SCI SC TR SLP342 CYYZ 202200Z 36009KT 15SM FEW020 M13/M20 A3046 RMK SCI SC TR SLP334 CYYZ 202100Z 35012KT 15SM FEW020 M13/M20 A3044 RMK SCI SC TR SLP326 CYYZ 2020002 01008KT 15SM FEW020 M12/M19 A3043 RMK SCI SC TR SLP321 CYYZ 201900Z 35007KT 320V030 15SM FEW020 M12/M20 A3043 RMK SCI SC TR SLP321 CYYZ 201800Z 01008KT 330V040 15SM SKC M13/M20 A3043 RMK SLP320 CYYZ 201700Z 35007KT 15SM FEW020 M14/M20 A3044 RMK SCI SC TR SLP324 CYYZ 201600Z 36008KT 15SM FEW020 M15/M20 A3044 RMK SCI SC TR SLP323 CYYZ 201500Z 01007KT 15SM SKC M16/M21 A3042 RMK SLP315 3. Correctly encode the following METAR report in the correct order. Conditions at: CYYZ (TORONTO/PEARSON, ON, CA) observed at 1000 UTC, 21 January, 2022 Temperature: -19.0C (-2.2F) Dew point: -22.0C (-7.6F) [RH = 77%] Pressure (altimeter): 30.58 inches Hg Sea level pressure: 1037.6 mb Winds: from the NW (330 degrees) at 9 KT (9 knots; 4.6 m/s) Visibility: 15 miles (24 km) Clouds: few clouds at 5,000 feet Weather: no significant weather observed at this time. bserved a C. Station Model At airports and other manned stations/point of observation throughout the country the weather is observed, measured and recorded. These stations record: temperature, dew point, cloud cover, visibility, height of cloud base, amount of precipitation, wind speed and wind direction to name a few. The measurements made every hour at every station around the world. This is a very large amount of data, which can be very useful in predicting the weather. Meteorologist use station models plotted on a weather map to perform a chart analysis, which is a subjective analysis (diagnostic). This is of fundamental importance as it helps forecasters to be able to locate weather systems, low and high pressure, other weather features such as dry-lines, moisture fronts, cold fronts etc. This is a very important analysis before any weather forecast can be issued using prognostic models. A simplified example of a station model plot used to represent meteorological surface conditions is shown in the accompanying figure below. The station model depicts current weather conditions, cloud cover, wind speed, wind direction, visibility, temperature, dew point temperature, atmospheric pressure adjusted to sea level, and the change in pressure over the last three hours. Plotted Station (surface analysis) PPP VV ww NPP a 00 TaTa C 24 TT 21 038 W PPP PP H ww W VV TaTa TT Example High Cloud type Middle Cloud type Low Cloudtyp Cloud Cover (portion of the sky covered) Atmospheric pressure. The pressure is indicated in millibars but only the last three digits are shown. For example, a pressure of 1002 1 will be indicated as 021 whereas a pressure of 1021.1 will be indicated as 211 Indicate the pressure change since the last observation (in millibars). Graphical representation of the pressure change Present Weather when the observation is taken Past Weather in the past hour at the time of the observation Valollity Code is kilometers Dew Point (in degrees Celsius) Air Temperature (in degrees Celsius) Overcast, with an air temperature of 24 degrees Celsius, dew point of 21 degrees Celsius. The wind was from the north-east between 10 and 14 knots. The pressure was 1003.8 milibars decreasing (1) of 1.1 millibars in the last 3 hours (11 on the chart) Rain showers with low clouds which were Stratus, the visibility was reduced to less than one kilometre. In the preceding hour of the observation, fog was the The following figure contains 3 types of clouds (according to height), high, medium and lov clouds. These symbols are used to when plotting a station model. High Clouds: type C DC (oimus) in the form of filaments, strands, or hooks, not progressively invading the sky dense Cl. in patches or entangled sheaves, which usually do not increase dense CL often in the form of an anvil, being the remains of the upper parts of Cb (cumulonimbus) NVB VB X BEL Ci in the form of hooks or of fiaments, or both, progressively invading the sky Ci and Cs (CiroStratus) or Cs alone in either case, they are progressively invading the sky, and generally growing denser as a whole, but the continuous veill does not reach 45 degrees above the horizon Ci and Cs or Cs alone: in either case, they are progressively invading the sky, and generally growing denser as a whole: the continuous veil extends more than 45 degrees above the horizon 25 of Cs covering the celestial dome Ca not progressively invading the sky and nupletely covering the celestial dome, Cl and Ce (CimeCumulus) may be present Co alone, or Co accompanied by Ci or Cs or both, but Co is predominant Middle Clouds: type Cu As (AltoStratus), the greater part of which is semi-transparent through the part the sun or moon may be weakly visible, as through ground glass As the greater part of which is sufficphey dense to hide the sun or moon, or Ns (NimboStratus) Ac (AltoCumulus), the greater part of which is semi-transparent the various elements of the cloud change only slowly and are all at a single level mince patches (often in the form of aimonds or fishes) of Ac. the greater part of which is semi-transparent; the clouds occur at one or more levels and the elements are continually changing in: rance semi-transparent Ac in bands, or Ac in one or more fairy continuous layers (semi-transparent or opaque progressively invading the sky, these atocumulus clouds generally thicken as a whole Ao resulting from the spreading out of Cu (Cumulus) Ac in two or more layers, usually opaque in places, and not progressively invading the hot progressively invading sky; or Ac togethers with sproutings in the form of small towers or battements lufts o of a chaotic sky, generally at several levels or opaque layer of Ac muliform Low Clouds: type CL & D P Cu (Cumulus) with little vertical extent and seemingly flattened Code 00: 02: 049 06: 08 10: 12 16: 20 24: 28 Cu of moderate or strong vertical extent, generally with protuberances in the form of domes or towers, either accompanied or not by other cumulus or by stratocumulus, all having their base at the same level. Cb (CumuloNimbus) the summits of which, at least partially, lack sharp outlines but are neither clearly fibrous cirriform) nor in the form of an anvil cumulus, stratocumulus, or stratus may also be present Se (StratoCumulus) formed by the spreading out of cumulus; cumulus may also be present Se not resulting from the spreading out of cumulus St (Stratus) or Sf (Stratus Fractus) in a more or less continuous sheet or layer, or in ragged shreds, or both, but no stratus fractus of bad weather Sf (stratus Fractus) of bad weather or cumulus fractus of bad weather, or both (pannus), usually below altostratus or himbostratus Cu and So other than that formed from from that of the stratocumulus Horizontal Visibility Code vs Kilometers (W) Code 32: Cb cumulonimbus, the upper part of which is clearly fibrous (oirriform), often in the form of an anvil: either accompanied or not by cumulonimbus without anvil or fibrous upper part, by cumulus, stratocumulus, stratus, or pannus I Km p 0.2 0.4 270.6 0.8 1 1.2 1.6 2.0 2.4 2.8 eading out of cumulus; the base of the cumulus is at a different level 31: 32: 36: 40: 48: 56: 15.4 58: 3 50: 19.8 54: 06: Km 3.2 3.6 48 11.2 12.8 14.4 16 ALISELTRO Code 67: 39: 70: 72: 749 30: 62 33: 35: HOW 58 30 30.8 39: greater than 70.4 Km 17.6 19.2 20.8 22.4 24 30.4 40 44.8 The circle in the station model represents the station and can be plot over the weather map on the corresponding latitude and longitude of the station. Total cloud cover is expressed as the fraction of cloud covering the sky. An open circle represents a clear sky and a filled-in circle represents an overcast sky. The temperature is expressed in degrees Fahrenheit (US) or Celsius (Canada). In the station model plot, temperature is plotted where the number 10 is on a clock (TT). The dew point temperature (TdTd) is plotted below (at about 8 o'clock) and in the same units as temperature. Visibility (VV) is how far we can see and (in the United States) is expressed in units of miles. On the station model, visibility is plotted between temperature and dew point (at about 9 o'clock). Immediately to the right of visibility is a current weather condition. Present weather: Other types of precipitation Rain Shower V R 2 40 + 8 8 Snow Shower -06 Thunderstorm Freezing drizzle Freezing rain Sleet Weather Symbols [M 085 aix ** S Smoke Haze Det Blowing Snow Lightning Funnel Cloud Light Fog Thick Fog Weather Element Lab Questions: 4. Using the station model below, decode the weather conditions and record the information displayed in the following Table: I Temperature (C) Pressure (mb) Wind Direction Precipitation at time of observations Type Light Moderate Heavy Drizzle 11 4 Wind Speed Rain Precipitation Type Percent of Sky Covered 13 ** Snow ** : Station 1 *** ****:--:- 5. Plot 3 station models using CYYZ observations 2019002, 210000z and 211000z (See page 8 & 9). H C. Station Model At airports and other manned stations/point of observation throughout the country the weather is observed, measured and recorded. These stations record: temperature, dew point, cloud cover, visibility, height of cloud base, amount of precipitation, wind speed and wind direction to name a few. The measurements made every hour at every station around the world. This is a very large amount of data, which can be very useful in predicting the weather. Meteorologist use station models plotted on a weather map to perform a chart analysis, which is a subjective analysis (diagnostic). This is of fundamental importance as it helps forecasters to be able to locate weather systems, low and high pressure, other weather features such as dry-lines, moisture fronts, cold fronts etc. This is a very important analysis before any weather forecast can be issued using prognostic models. A simplified example of a station model plot used to represent meteorological surface conditions is shown in the accompanying figure below. The station model depicts current weather conditions, cloud cover, wind speed, wind direction, visibility, temperature, dew point temperature, atmospheric pressure adjusted to sea level, and the change in pressure over the last three hours. Plotted Station (surface analysis) PPP VV ww NPP a 00 TaTa C 24 TT 21 038 W PPP PP H ww W VV TaTa TT Example High Cloud type Middle Cloud type Low Cloudtyp Cloud Cover (portion of the sky covered) Atmospheric pressure. The pressure is indicated in millibars but only the last three digits are shown. For example, a pressure of 1002 1 will be indicated as 021 whereas a pressure of 1021.1 will be indicated as 211 Indicate the pressure change since the last observation (in millibars). Graphical representation of the pressure change Present Weather when the observation is taken Past Weather in the past hour at the time of the observation Valollity Code is kilometers Dew Point (in degrees Celsius) Air Temperature (in degrees Celsius) Overcast, with an air temperature of 24 degrees Celsius, dew point of 21 degrees Celsius. The wind was from the north-east between 10 and 14 knots. The pressure was 1003.8 milibars decreasing (1) of 1.1 millibars in the last 3 hours (11 on the chart) Rain showers with low clouds which were Stratus, the visibility was reduced to less than one kilometre. In the preceding hour of the observation, fog was the h) present weather, i) cloud amount, cloud type (only for cumulonimbus and towering cumulus clouds) and height of cloud base or, where measured, vertical visibility; j) air temperature and dew-point temperature; and k) QNH and, when applicable, QFE (QFE included only in local routine and special reports). Recommendation. In addition to elements listed under (a) to (k), local routine reports, local special reports, METAR and SPECI should contain supplementary information to be placed after element k). Optional elements included under supplementary information shall be included in METAR and SPECI in accordance with regional air navigation agreement. Symbolic form of the Canadian METAR code METAR or Special report (SPECI) CCCC YYGGggZ AUTO BBB dddffGfmfmKTdadada Vd.d.d.VVVVSM (RDRDR/VRVRVRVRFT/i or RDRDR/VRVRVRVRVVRVRVRVRFT/i) w'w' (N,N,N,h,h,h, and/or VVh,h,h,) TT/T&T&APHPHPHPH(WS RWYDRDR or WS ALL RWY) RMK (Layer type and amount general remarks) SLPppp= Brief description of the METAR code. Code METAR or SPECI CCCC YYGGggZ AUTO BBB dddffGfmfmKT Description The code name METAR or SPECI shall be included at the beginning of an individual report Four-letter identifier beginning with the letter "C" which identifies it as a Canadian station YY: Day of month GG: Hour of the day gg: Minute of the hour Z: Indicates UTC Automatic station indicator Correction indicator ddd:2min mean direction. ff:2min mean speed Gfmf dadad VdxdxdxVVVVSM VVVVSM (RDRDR/VRVRVRVRFT/i or RDRDR/VRVRVRVRVVRVRVRVRFT/I) W'W' (N.N.Nshshshs and/or VVhshshs) TT/T&T APPHPPH (WS RWYDRDR or WS ALL RWY) RMK . . For Example: This METAR example is from Trenton-Mercer Airport near Trenton, New Jersey, and was taken on 5 December 2003 at 18:53 UTC. . METAR KTTN 0518532, 04011KT 1/2SM VCTS SN FZFG BKN003 OVC010 M02/M02 A3006 RMK A02 TSB40 SLP176 P0002 T10171017- . KT:Units indn: First counter-clockwise wind direction from the mean wind direction. METAR indicates that the following is a standard hourly observation. KTTN is the ICAO identifier for the Trenton-Mercer Airport. 0518537 indicates the day of the month is the fifth and the time of day is 1853 Zulu/UTC. 6:53PM GMT. . V: Variable indicator that is mandatory when this group is reported. . dxdxdx: Last clockwise wind direction from the mean wind direction . Prevailing visibility in SM Run-way visual range Present weather Sky condition Dry & Dew point temperature in Celsius and altimeter setting WS: wind shear RWY: run way DRDR: run way name. Additional information 04011KT indicates the wind is from 040 truc (north east) at 11 KT (20 km/h; 13 mph). In the United States, the wind direction must have a 60" or greater variance for variable wind direction to be reported and the wind speed must be 7 KT (13 km/h: 8 mph) or higher. 1/2SM indicates the prevailing visibility is 0.5 statute miles (800 m). VCTS indicates a thunderstorm in the vicinity (within 10SM (16 km), but beyond SSM (8 km)). SN indicates snow is falling at a moderate intensity. If any precipitation begins with a minus or plus (-/+), it's either light or heavy. FZFG indicates the presence of freezing fog 3 . . Note that what follows are not part of standard observations outside of the United States and can vary significantly . . RMK indicates the remarks section follows. A02 indicates that the station is automated with a rain/snow precipitation sensor. Stations that aren't equipped with a rain/snow sensor are designated AOL. . . . . BKN003 OVC010 indicates a broken cloud layer at 300 ft (91 m) above ground level and a solid or overcast layer at 1,000 ft (300 m). The last two zeros are omitted. M02/M02 indicates the temperature is -2 C (28 "F) and the dewpoint is -2 C (28 "F). An M in front of the number indicates that the temperature/dew point is below zero (0) Celsius. A3006 indicates the altimeter setting is 30.06 inHg (1,018 hPa). O 9 TSB40 indicates the thunderstorm began at 40 minutes past the hour at 1840 Zulu/UTC, 6:40PM GMT, or 1:40PM Eastern Standard Time. SLP176 indicates the current barometric pressure extrapolated to sea level is 1017.6 hPa. P0002 indicates that 0.02 inches (0.5 mm) of liquid-equivalent precipitation accumulated during the last hour. Cloud reporting: Cloud coverage is reported by the number of 'oktas' (eighths) of the sky that is occupied by cloud. T10171017 is a breakdown of the temperature and dew point in 8 digits separated into two groups of four, the first four digits (1017) is the temperature. The first digit (1) designates above or below zero Celsius (0-above zero 1-below zero). The next three digits in the group 017 is the temperature in degrees and tenths of a degree, -1.7 C (29 F). The last four digits '1017' is the same as the first group but for dew point. -1.7 C (29 F) -indicates the end of the METAR report. D Ok nedaud C O 30 Ok Schim This is reported as: o SKC No cloud' used worldwide but in North America is used to indicate a human generated report CLR- No clouds below 12,000 ft (3,900 m) (US) or 10,000 ft (3,000 m) (Canada) used mainly within North America and indicates a station that is at least partly automated NSC No (nil) significant cloud (i.e. none below 5,000 ft (1.500 m) and no TCU or CB) not used in North America O FEW-Few-1-2 oktas O SCT-Scattered-3-4 oktas O BKN-Broken-5-7 oktas O OVC-Overcast-8 oktas (ie, full cloud coverage) word The following are METAR abbreviations used in the United States, however some are used worldwide: METAR and TAF Abbreviations and Acronyms: Abbreviation Abbreviation (+) S ACC ACSL A01 APCH APRX AUTO BC BL C CB od CHI CIG CONS DOC DOT DS DSNT DVR E FC FG FIRST FMH2 FRO FU FZRANO GR HLSTO DC INCRO KT LAST LTG M Meaning maintenance check indicator light intensity altocumulus castellanus altocumulus standing lenticular cloud automated station without precipitation discriminator Approach Approximately fully automated report Patches Blowing center (with reference to runway designation) cumulonimbus cloud cloud-cloud lightning Candela cloud-height indicator ceiling continuous Department of Commerce Department of Transportation duststorm distant dispatch visual range east, ended, estimated ceiling (SAO) funnel cloud fog first observation after a break in coverage at manual station Federal Meteorological Handbook No.2, Surface Synoptic Codes frequent moke freezing rain sensor not available hail hailstone ice crystals, in-cloud lightning increasing KNOTS Jast observation before a break in coverage at a manual station igining mimas, less than ACFT MSHP ALP A02 APRNT ATCT B BKN BR CA CBMAM CCSL co CHINO CLR COR DOD DR DSIPTO DU DZ FAA FEW FIBI FMH-1 FROPA FT FZ G GS HZ ICAO INTMT L LST LWR mas 5 Meaning heavy intensity indicator that visual range data follows; separator between temperature and dew point data. aircraft mishap airport location point automated station with precipitation discriminator apparent airport traffic control tower began broken (5-7/8ths of the sky covered with cloud) mist (from the word brume) cloud-air lightning cumulonimbus mammatus cloud cirrocumubas standing lenticular cloud cloud-ground lightning ky condition at secondary location not available clear sky correction to a previously disseminated observation Department of Defense low drifting dissipating widespread dust drizzle Federal Aviation Administration few clouds (1-2/8ths of the sky covered with cloud) filed but impracticable to transmit Federal Meteorological Handbook No.1, Surface Weather Observations & Reports (METAR) frontal passage feet freezing beast small hail and or snow pellets haze International Civil Aviation Organization intermitent left (with reference to runway designation) Local Standard Time Arwer METAR min MT NA NE NOSPECI NW OCNI OHD OVR PCPN PL PO PRES PRESRR PY RA RV RVRNO s SCSL SE SG SKC SLPNO SN SP SQ STN TCU TSNO UNKN UTC VA VIS VR VV WOSO WND WSHFT routine weather report provided at fixed intervals minimum mountains not applicable NCDC northeast NOS no SPECI reports are taken at the station NOTAM northwest occasional overhead over precipitation ice pellets dust/sand whirls (dust devils) Atmospheric pressure pressure rising rapidly spray rain reportable value RVR system values not available snow, south stratocumulus standing lenticular cloud southeast snow grains sky clear sea-level pressure not available snow snow pellets qualle station towering cumulus thunderstorm information not available ME MOV N unknown Coordinated Universal Time NWS OFCM ove P PK WND PNO PR PRESEK PWINO R RTD RVR RY SA SCT SFC SH SLP SM SNINCR SPECI SS sw TS TWR UP V VC volcanic ash visibility VISNO visual range VRB vertical visibility W Working Group for Surface Observations WMO wind ws wind shift 2 shallow moved moving/movement north National Climatic Data Center National Ocean Survey Notice to Airmen National Weather Service Office of the Federal Coordinator for Meteorology overcast (8/8ths of the sky covered with cloud) indicates greater than the highest reportable value peak wind precipitation amount not available rtial pressure falling rapidly precipitation identifier sensor not available right (with reference to runway designation), runway Routine Delayed (late) observation Runway visual range runway sand scattered (3-4/8ths of the sky covered with cloud) surface (Le ground level) shower(s) sea-level pressure stante miles snow increasing rapidly an unscheduled report taken when certain criteria have been met sandstorm shower, southwest thandentonn tower unknown precipitation variable in the vicinity visibility at secondary location not available variable west World Meteorological Organization wind shear Zulu, Le Coordinated Universal Time Date/time of observation and other indicators (YYGGERZ AUTO BBB) The date/time of observation (YYGGggZ) shall be included in all reports. The date and time of observation on the hour is used for all METAR reports. In SPECIreports the time refers to the time of occurrence (hour and minutes) of the change(s) in observed elements that required the issue of the SPECI report. The exception is with reporting the end of thunderstorms and precipitation. (See 16.4.4.6 and 16.4.4.2.) 6 YY: Day of month GG: Hour of the day gg: Minute of the hour Z: Indicates UTC AUTO: Automatic station indicator. Indicates the report is from an auto station BBB: Correction indicator. Formed by the letters CC preceding an incremented letter to indicate the corrected observation. Use CCA for first correction, CCB for second correction and so on. Example (1): An automated aviation report taken at Moosonce (CYMO) airport on the 4th day at 0600Z. METAR CYMO 040600Z AUTO 30002KT 9SM FEW014 BKN024 OVC085 01/01 A2976 RMK SLP078 Example (2): A special aviation observation taken at Quebec City Jean Lesage International (CYQB) Airport on the 10th day at 12112. SPECI CYQB 101211Z 25007KT 4SM-SHRA BR BKN020TCU 13/12 A3003 RMK TCU6 SLP171 Example (3): Weather observation taken at Calgary International (CYYC) Airport on the 5th day at 12002. This is the second correction to the 1200Z METAR. METAR CYYC 051200Z CCB 31009KT 40SM FEW050 BKN160 OVC240 07/M03 A2980 RMK CUIACSC12 SLP098 16.3.4 Wind velocity (dddffGf_f_KT) the surface wind is blowing and is always three ddd: The two-minute mean wind direction from digits, given in degrees true but rounded off to the nearest 10 degrees. ff: The two-minute mean wind speed; two digits if under 100, three digits if over 100. (see 7.1.2) Gff: Gust information will be included if gust speeds exceed the two-minute mean wind speed (ff) by 5 knots or more and the highest peak is at least 15 knots in the 10-minute period preceding the observation. If this condition is not met, this group shall not be reported. G indicates gust and ff is the peak gust speed reported, using two or three digits as required. KT: Indicates the units are knots. Note (1): When suitable wind instruments are lacking, or when the wind instruments are not in operating condition, the wind direction and speed shall be estimated (see 7.4) and remarks entered. (see 16.3.13.2.1) Use the Beaufort scale knots average for the speed. Example: Wind estimated 230 degrees true at 9 knots METAR CYYC 051200Z 230009KT 15SM FEW050 BKN160 OVC240 07/M03 A2980 RMK CULACSC12 WND ESTD SLP098 Note (2): CALM wind is reported for mean wird speeds of less than 2 knots. wit Example: Calm wind. SPECI CYQB 101211Z 00000KT 4SM BR FEW020 13/12 A3003 RMK PGISCI SLP171 Note (3): When squalls are observed, the peak wind speed shall be reported as a gust and "SQ" shall be reported in present weather. (see 7.1.3.2.) Example: Squall with a peak wind speed of 36 knots. METAR CYYT 2414002 25015036KT 10SM SQ OVC009 17/13 A2979 RMK SFS VIS LWR N SLP089 Note (4): In the case of variable wind direction, ddd shall be coded as VRB when the wind speed is less than 3 knots. A variable wind at higher speeds shall be reported only when the variation of wind direction is 180 or more or when it is impossible to determine a single wind direction. Example (1): Wind direction is varying from 030 degrees to 140 degrees and the mean wind direction is 080 degrees but the mean wind speed is 2 knots. METAR CYQB 0415002 VRB02KT 30SM FEW040 18/10 A3003 RMK SC2 SLP169 Example (2): Wind direction is varying from 030 degrees to 240 degrees and the mean wind direction is undeterminable. The mean wind speed is 4 knots. METAR CYQB 041500Z VRB04KT 30SM FEW040 18/10 A3003 RMK SC2 SLP169 16.3.5 Variation in wind direction (dndndnVdxdxdx) dndndn: First counter-clockwise wind direction from the mean wind direction. V: Variable indicator that is mandatory when this group is reported. dxdxdx: Last clockwise wind direction from the mean wind direction. If, during the 10-minute period preceding the observation, the total variation in wind direction is 60 or more and less than 180 and the mean wind speed is 3 knots or greater, the observed two extreme directions between which the wind has varied shall be given for dndndnVdxdxdxin clockwise order. Otherwise the group shall not be included. Example: Wind direction is varying from 060 degrees to 133 degrees. The mean wind direction is 100 degrees. The mean wind speed is 9 knots. METAR CYQB 041300Z 10009KT 060V130 30SM FEW040 BKN070 16/09 A3003 RMK SC2AC4 SLP169 16.3.6 Prevailing visibility (VVVVSM) The prevailing visibility shall be reported in statute miles and fractions of statute miles followed by the letters "SM" to indicate units. If the observed preting visibility is between two reportable values, the "lower" value shall be used (see 2.3). VVVV: Prevailing visibility SM: Indicates the units are statute miles Lab Questions: 1. Decode the following METAR data, and plot lines to show the time evolution of a) temperature, b) dew point temperature, c) wind speed, and d) sea-level pressure (NOTE: a. Plot physical variable on Y-axis and time on X-axis; b. skip missing data point) 2. Find the maximum and minimum values of the temperature from the plot and discuss the main reason for daily maximum and minimum values of the temperature. CYYZ 220212Z 06002KT 15SM-SN BKN021 M12/M16 A3054 RMK SC5 SLP361 CYYZ 2202002 03003KT 15SM BKN021 M12/M15 A3055 RMK SC5 SLP363 CYYZ 2201002 06002KT 15SM FEW025 M12/M16 A3056 RMK SCI SC TR SLP368 CYYZ 220000Z 11003KT 15SM FEW040 M11/M16 A3057 RMK SCI SC TR SLP371 CYYZ 212300Z 15003KT 15SM FEW040 M11/M16 A3058 RMK SCI SC TR SLP374 CYYZ 2122002 17004KT 160V240 15SM FEW040 MIL/M17 A3058 RMK SCI SC TR SLP375 CYYZ 2121002 33003KT 280V340 15SM FEW040 MIO/M18 A3060 RMK SCI SC TR SLP380 CYYZ 212000Z 29002KT 15SM FEW020 M10/M18 A3060 RMK CFI CF TR SLP381 CYYZ 211900Z VRB02KT 15SM FEW020 FEW220 M11/M19 A3061 RMK CFICII CFTR CITR SLP384 CYYZ 2118002 31002KT 15SM FEW014 FEW080 M12/M20 A3063 RMK SFIACI SE TRAC TR SLP389 CYYZ 211700Z VRB02KT 15SM FEW014 FEW080 M13/M22 A3064 RMK SFLACI SE TRAC TR SLP395 CYYZ 2116002 04002KT 15SM FEW017 FEWO80 M15/M23 A3066 RMK SFIACI SE TR AC TR SLP402 CYYZ 2115002 02004KT 15SM FEW040 FEWO80 M17/M23 A3065 RMK SCIACI SC TR AC TR SLP399 CYYZ 2114002 01006KT 15SM FEW060 M18/M24 A3065 RMK SCI SC TR SLP398 CYYZ 2113002 05003KT 030V090 15SM SKC M18/M24 A3063 RMK FROIN SLP391 CYYZ 211200Z 03004KT 15SM SKC M19/M24 A3063 RMK SLP390 CYYZ 2111002 01005KT 15SM BKN019 M19/M23 A3061 RMK SCS SLP383 CYYZ 211000Z 33009KT 15SM FEWO50 M19/M22 A3058 RMK SCI FROIN SLP376 CYYZ 210900Z 35006KT 15SM FEWO50 M19/M22 A3058 RMK SCI SC TR FROIN SLP373 CYYZ 2108002 02005KT 15SM FEW050 M19/M22 A3057 RMK SCI SC TR FROIN SLP371 8 CYYZ 210700Z 02003KT 15SM FEW040 M19/M23 A3056 RMK SC1 SC TR SLP366 CYYZ 210600Z 35002KT 15SM FEW260 M18/M21 A3055 RMK CII CI TR SLP364 CYYZ 210500Z 33003KT 15SM SKC M17/M21 A3056 RMK SLP367 CYYZ 2104002 00000KT 15SM SCT023 M17/M21 A3055 RMK SC4 SLP365 CYYZ 210300Z 36003KT 310V030 15SM FEW030 M16/M21 A3055 RMK SCI SLP363 CYYZ 210200Z 34006KT 15SM SKC M15/M21 A3053 RMK SLP358 CYYZ 2101002 3200SKT 15SM SKC M15/M21 A3052 RMK SLP353 CYYZ 210000Z 32006KT 15SM SKC M14/M20 A3051 RMK SLP350 CYYZ 202300Z 36009KT 15SM FEW025 M14/M20 A3049 RMK SCI SC TR SLP342 CYYZ 202200Z 36009KT 15SM FEW020 M13/M20 A3046 RMK SCI SC TR SLP334 CYYZ 202100Z 35012KT 15SM FEW020 M13/M20 A3044 RMK SCI SC TR SLP326 CYYZ 2020002 01008KT 15SM FEW020 M12/M19 A3043 RMK SCI SC TR SLP321 CYYZ 201900Z 35007KT 320V030 15SM FEW020 M12/M20 A3043 RMK SCI SC TR SLP321 CYYZ 201800Z 01008KT 330V040 15SM SKC M13/M20 A3043 RMK SLP320 CYYZ 201700Z 35007KT 15SM FEW020 M14/M20 A3044 RMK SCI SC TR SLP324 CYYZ 201600Z 36008KT 15SM FEW020 M15/M20 A3044 RMK SCI SC TR SLP323 CYYZ 201500Z 01007KT 15SM SKC M16/M21 A3042 RMK SLP315 3. Correctly encode the following METAR report in the correct order. Conditions at: CYYZ (TORONTO/PEARSON, ON, CA) observed at 1000 UTC, 21 January, 2022 Temperature: -19.0C (-2.2F) Dew point: -22.0C (-7.6F) [RH = 77%] Pressure (altimeter): 30.58 inches Hg Sea level pressure: 1037.6 mb Winds: from the NW (330 degrees) at 9 KT (9 knots; 4.6 m/s) Visibility: 15 miles (24 km) Clouds: few clouds at 5,000 feet Weather: no significant weather observed at this time. bserved a C. Station Model At airports and other manned stations/point of observation throughout the country the weather is observed, measured and recorded. These stations record: temperature, dew point, cloud cover, visibility, height of cloud base, amount of precipitation, wind speed and wind direction to name a few. The measurements made every hour at every station around the world. This is a very large amount of data, which can be very useful in predicting the weather. Meteorologist use station models plotted on a weather map to perform a chart analysis, which is a subjective analysis (diagnostic). This is of fundamental importance as it helps forecasters to be able to locate weather systems, low and high pressure, other weather features such as dry-lines, moisture fronts, cold fronts etc. This is a very important analysis before any weather forecast can be issued using prognostic models. A simplified example of a station model plot used to represent meteorological surface conditions is shown in the accompanying figure below. The station model depicts current weather conditions, cloud cover, wind speed, wind direction, visibility, temperature, dew point temperature, atmospheric pressure adjusted to sea level, and the change in pressure over the last three hours. Plotted Station (surface analysis) PPP VV ww NPP a 00 TaTa C 24 TT 21 038 W PPP PP H ww W VV TaTa TT Example High Cloud type Middle Cloud type Low Cloudtyp Cloud Cover (portion of the sky covered) Atmospheric pressure. The pressure is indicated in millibars but only the last three digits are shown. For example, a pressure of 1002 1 will be indicated as 021 whereas a pressure of 1021.1 will be indicated as 211 Indicate the pressure change since the last observation (in millibars). Graphical representation of the pressure change Present Weather when the observation is taken Past Weather in the past hour at the time of the observation Valollity Code is kilometers Dew Point (in degrees Celsius) Air Temperature (in degrees Celsius) Overcast, with an air temperature of 24 degrees Celsius, dew point of 21 degrees Celsius. The wind was from the north-east between 10 and 14 knots. The pressure was 1003.8 milibars decreasing (1) of 1.1 millibars in the last 3 hours (11 on the chart) Rain showers with low clouds which were Stratus, the visibility was reduced to less than one kilometre. In the preceding hour of the observation, fog was the The following figure contains 3 types of clouds (according to height), high, medium and lov clouds. These symbols are used to when plotting a station model. High Clouds: type C DC (oimus) in the form of filaments, strands, or hooks, not progressively invading the sky dense Cl. in patches or entangled sheaves, which usually do not increase dense CL often in the form of an anvil, being the remains of the upper parts of Cb (cumulonimbus) NVB VB X BEL Ci in the form of hooks or of fiaments, or both, progressively invading the sky Ci and Cs (CiroStratus) or Cs alone in either case, they are progressively invading the sky, and generally growing denser as a whole, but the continuous veill does not reach 45 degrees above the horizon Ci and Cs or Cs alone: in either case, they are progressively invading the sky, and generally growing denser as a whole: the continuous veil extends more than 45 degrees above the horizon 25 of Cs covering the celestial dome Ca not progressively invading the sky and nupletely covering the celestial dome, Cl and Ce (CimeCumulus) may be present Co alone, or Co accompanied by Ci or Cs or both, but Co is predominant Middle Clouds: type Cu As (AltoStratus), the greater part of which is semi-transparent through the part the sun or moon may be weakly visible, as through ground glass As the greater part of which is sufficphey dense to hide the sun or moon, or Ns (NimboStratus) Ac (AltoCumulus), the greater part of which is semi-transparent the various elements of the cloud change only slowly and are all at a single level mince patches (often in the form of aimonds or fishes) of Ac. the greater part of which is semi-transparent; the clouds occur at one or more levels and the elements are continually changing in: rance semi-transparent Ac in bands, or Ac in one or more fairy continuous layers (semi-transparent or opaque progressively invading the sky, these atocumulus clouds generally thicken as a whole Ao resulting from the spreading out of Cu (Cumulus) Ac in two or more layers, usually opaque in places, and not progressively invading the hot progressively invading sky; or Ac togethers with sproutings in the form of small towers or battements lufts o of a chaotic sky, generally at several levels or opaque layer of Ac muliform Low Clouds: type CL & D P Cu (Cumulus) with little vertical extent and seemingly flattened Code 00: 02: 049 06: 08 10: 12 16: 20 24: 28 Cu of moderate or strong vertical extent, generally with protuberances in the form of domes or towers, either accompanied or not by other cumulus or by stratocumulus, all having their base at the same level. Cb (CumuloNimbus) the summits of which, at least partially, lack sharp outlines but are neither clearly fibrous cirriform) nor in the form of an anvil cumulus, stratocumulus, or stratus may also be present Se (StratoCumulus) formed by the spreading out of cumulus; cumulus may also be present Se not resulting from the spreading out of cumulus St (Stratus) or Sf (Stratus Fractus) in a more or less continuous sheet or layer, or in ragged shreds, or both, but no stratus fractus of bad weather Sf (stratus Fractus) of bad weather or cumulus fractus of bad weather, or both (pannus), usually below altostratus or himbostratus Cu and So other than that formed from from that of the stratocumulus Horizontal Visibility Code vs Kilometers (W) Code 32: Cb cumulonimbus, the upper part of which is clearly fibrous (oirriform), often in the form of an anvil: either accompanied or not by cumulonimbus without anvil or fibrous upper part, by cumulus, stratocumulus, stratus, or pannus I Km p 0.2 0.4 270.6 0.8 1 1.2 1.6 2.0 2.4 2.8 eading out of cumulus; the base of the cumulus is at a different level 31: 32: 36: 40: 48: 56: 15.4 58: 3 50: 19.8 54: 06: Km 3.2 3.6 48 11.2 12.8 14.4 16 ALISELTRO Code 67: 39: 70: 72: 749 30: 62 33: 35: HOW 58 30 30.8 39: greater than 70.4 Km 17.6 19.2 20.8 22.4 24 30.4 40 44.8 The circle in the station model represents the station and can be plot over the weather map on the corresponding latitude and longitude of the station. Total cloud cover is expressed as the fraction of cloud covering the sky. An open circle represents a clear sky and a filled-in circle represents an overcast sky. The temperature is expressed in degrees Fahrenheit (US) or Celsius (Canada). In the station model plot, temperature is plotted where the number 10 is on a clock (TT). The dew point temperature (TdTd) is plotted below (at about 8 o'clock) and in the same units as temperature. Visibility (VV) is how far we can see and (in the United States) is expressed in units of miles. On the station model, visibility is plotted between temperature and dew point (at about 9 o'clock). Immediately to the right of visibility is a current weather condition. Present weather: Other types of precipitation Rain Shower V R 2 40 + 8 8 Snow Shower -06 Thunderstorm Freezing drizzle Freezing rain Sleet Weather Symbols [M 085 aix ** S Smoke Haze Det Blowing Snow Lightning Funnel Cloud Light Fog Thick Fog Weather Element Lab Questions: 4. Using the station model below, decode the weather conditions and record the information displayed in the following Table: I Temperature (C) Pressure (mb) Wind Direction Precipitation at time of observations Type Light Moderate Heavy Drizzle 11 4 Wind Speed Rain Precipitation Type Percent of Sky Covered 13 ** Snow ** : Station 1 *** ****:--:- 5. Plot 3 station models using CYYZ observations 2019002, 210000z and 211000z (See page 8 & 9). H
Step by Step Solution
★★★★★
3.59 Rating (163 Votes )
There are 3 Steps involved in it
Step: 1

Get Instant Access to Expert-Tailored Solutions
See step-by-step solutions with expert insights and AI powered tools for academic success
Step: 2

Step: 3

Ace Your Homework with AI
Get the answers you need in no time with our AI-driven, step-by-step assistance
Get Started


