Answered step by step
Verified Expert Solution
Link Copied!

Question

1 Approved Answer

c. Suppose instead Susan is purchasing insurance in an adversely selected market. A graph of the amount of insurance (as % of expenses covered) is
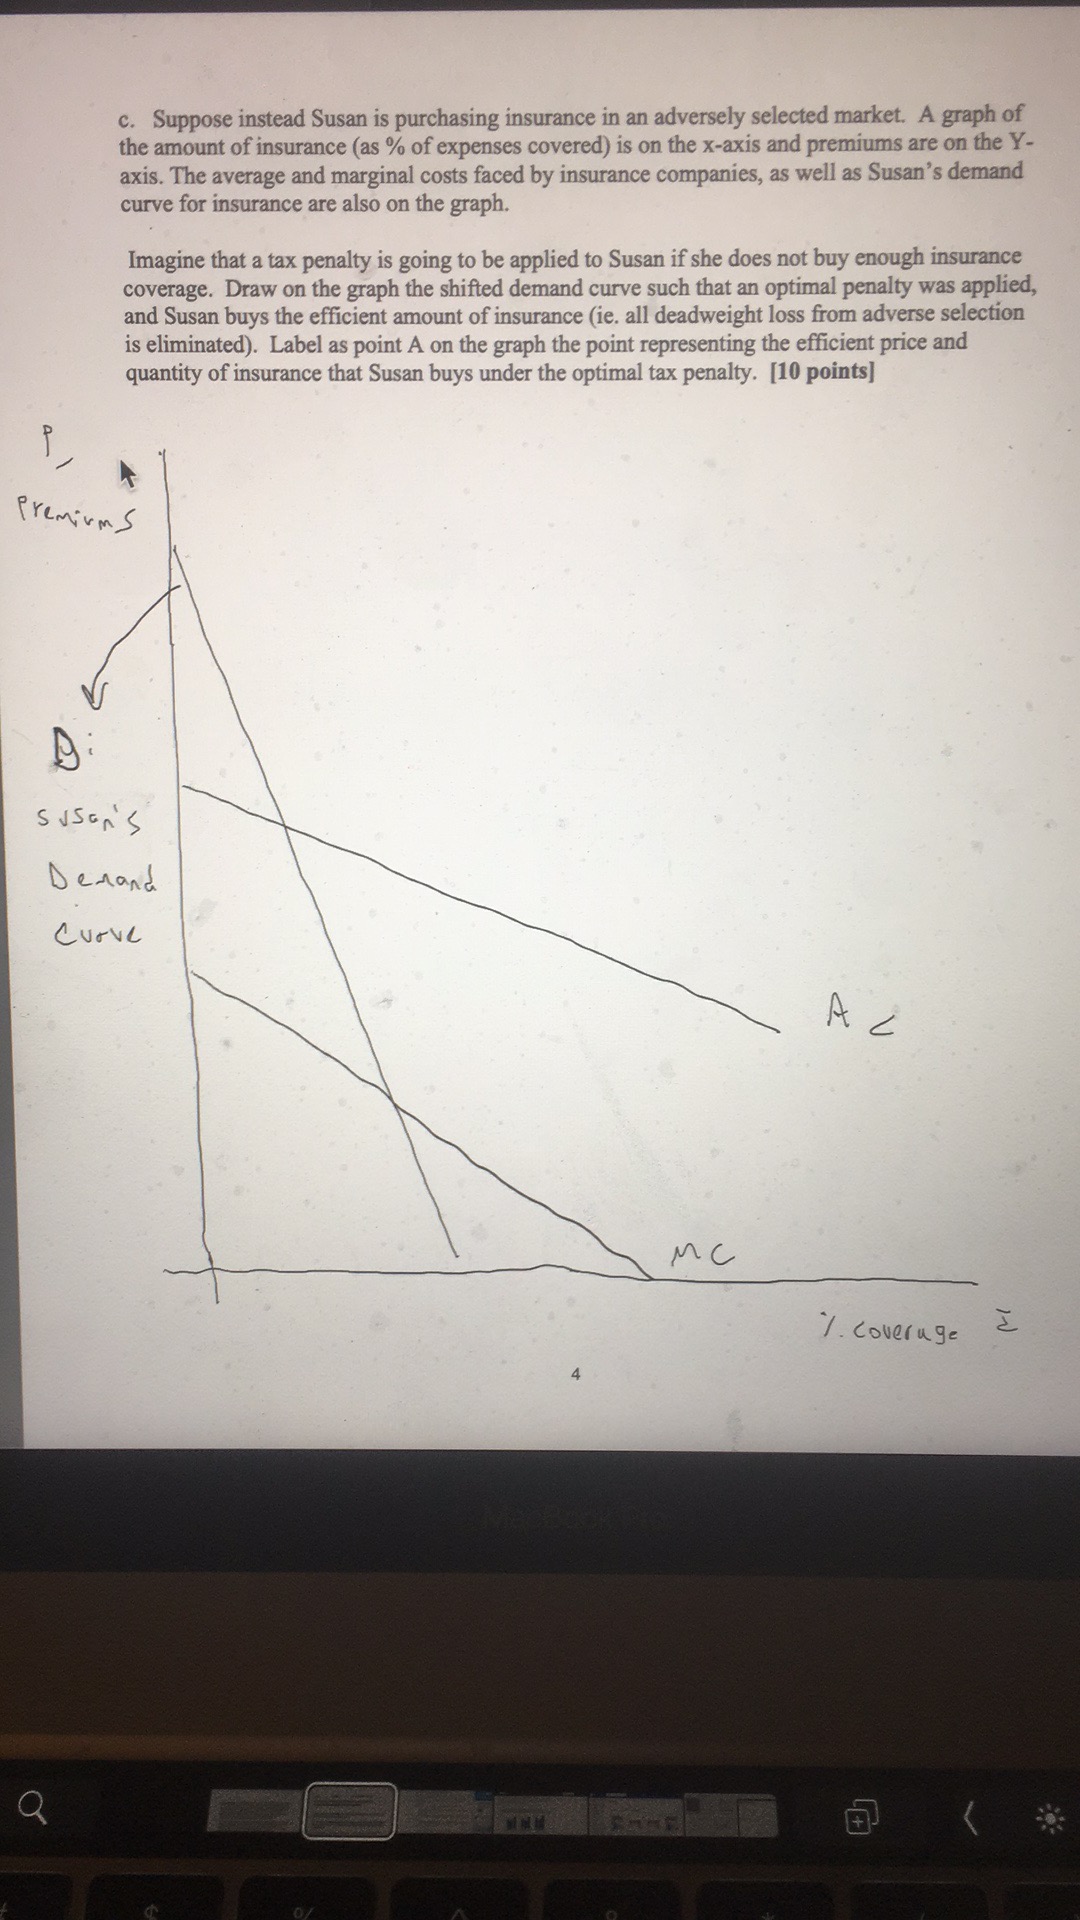
image text in transcribed
c. Suppose instead Susan is purchasing insurance in an adversely selected market. A graph of the amount of insurance (as % of expenses covered) is on the x-axis and premiums are on the Y- axis. The average and marginal costs faced by insurance companies, as well as Susan's demand curve for insurance are also on the graph. Imagine that a tax penalty is going to be applied to Susan if she does not buy enough insurance coverage. Draw on the graph the shifted demand curve such that an optimal penalty was applied, and Susan buys the efficient amount of insurance (ie. all deadweight loss from adverse selection is eliminated). Label as point A on the graph the point representing the efficient price and quantity of insurance that Susan buys under the optimal tax penalty. [10 points] premiums susans Demand Curve A C MC 1. coverage 4

Step by Step Solution

There are 3 Steps involved in it

Step: 1

blur-text-image

Get Instant Access to Expert-Tailored Solutions

See step-by-step solutions with expert insights and AI powered tools for academic success

Step: 2

blur-text-image

Step: 3

blur-text-image

Ace Your Homework with AI

Get the answers you need in no time with our AI-driven, step-by-step assistance

Get Started

Recommended Textbook for

Managerial economics applications strategy and tactics

Authors: James r. mcguigan, R. Charles Moyer, frederick h. deb harris

12th Edition

9781133008071, 1439079234, 1133008070, 978-1439079232

More Books

Students also viewed these Economics questions