Answered step by step
Verified Expert Solution
Question
1 Approved Answer
(c) The Ford-Fulkerson algorithm is used to determine network flow. The diagram below represents a data network that connects a Data Service Provider (DSP) connected
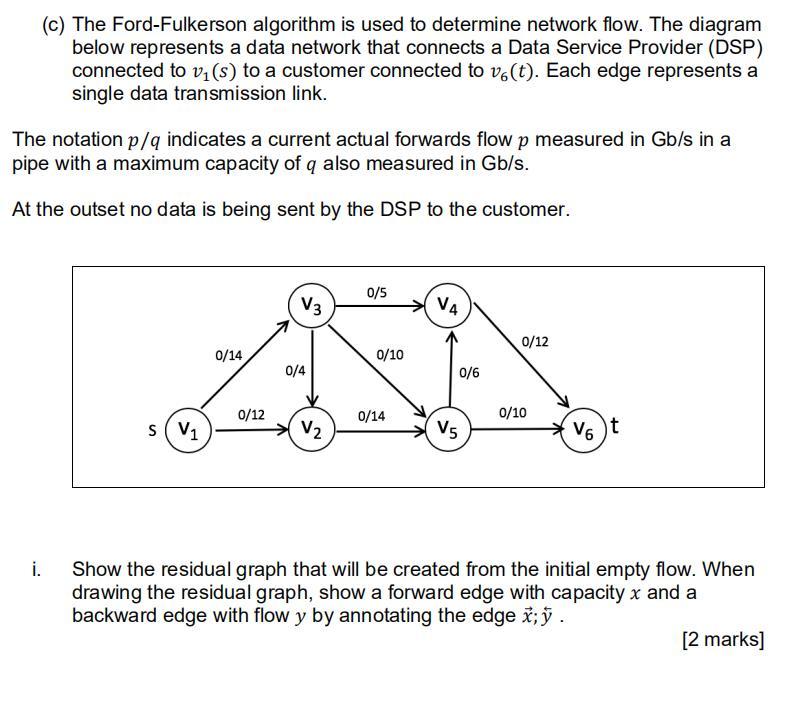
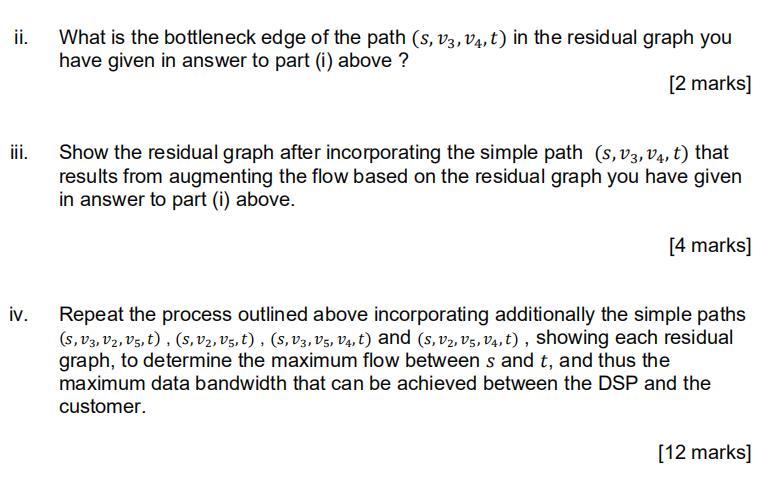
(c) The Ford-Fulkerson algorithm is used to determine network flow. The diagram below represents a data network that connects a Data Service Provider (DSP) connected to vi(s) to a customer connected to v6(t). Each edge represents a single data transmission link. The notation p/q indicates a current actual forwards flow p measured in Gb/s in a pipe with a maximum capacity of q also measured in Gb/s. At the outset no data is being sent by the DSP to the customer. 0/5 V3 VA 0/12 0/14 0/10 0/4 0/6 0/12 0/14 0/10 s V1 V2 V. V6 t i. Show the residual graph that will be created from the initial empty flow. When drawing the residual graph, show a forward edge with capacity x and a backward edge with flow y by annotating the edge x;j. [2 marks] ii. What is the bottleneck edge of the path (s, 03, 04,t) in the residual graph you have given in answer to part (1) above ? [2 marks] iii. Show the residual graph after incorporating the simple path (s, 03, 04, t) that results from augmenting the flow based on the residual graph you have given in answer to part (i) above. [4 marks] iv. Repeat the process outlined above incorporating additionally the simple paths (S, V3, V2, V5,t), (, V2, V5,t), (S, V3, V5, V4,t) and (s, V2, V5, V4,t), showing each residual graph, to determine the maximum flow between s and t, and thus the maximum data bandwidth that can be achieved between the DSP and the customer. (12 marks]
Step by Step Solution
There are 3 Steps involved in it
Step: 1
Get Instant Access to Expert-Tailored Solutions
See step-by-step solutions with expert insights and AI powered tools for academic success
Step: 2
Step: 3
Ace Your Homework with AI
Get the answers you need in no time with our AI-driven, step-by-step assistance
Get Started