Answered step by step
Verified Expert Solution
Question
1 Approved Answer
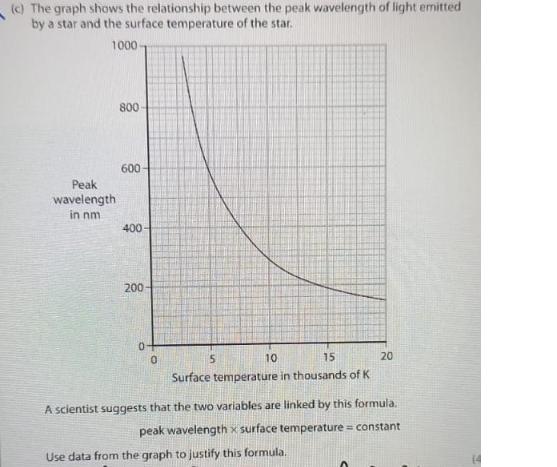
(c) The graph shows the relationship between the peak wavelength of light emitted by a star and the surface temperature of the star. 1000

(c) The graph shows the relationship between the peak wavelength of light emitted by a star and the surface temperature of the star. 1000 Peak wavelength in nm 800 600- 400 200- 0 5 10 15 Surface temperature in thousands of K 20 A scientist suggests that the two variables are linked by this formula. peak wavelength x surface temperature = constant Use data from the graph to justify this formula.
Step by Step Solution
There are 3 Steps involved in it
Step: 1
Answer Inverse Relationship Explanation The graph shows that as the surface temperature of the star in thousands of Kelvin increases the peak waveleng...
Get Instant Access to Expert-Tailored Solutions
See step-by-step solutions with expert insights and AI powered tools for academic success
Step: 2

Step: 3

Ace Your Homework with AI
Get the answers you need in no time with our AI-driven, step-by-step assistance
Get Started


