

Question
c Two standard normal curves are shown below one for the confidence interval calculated in part a and one for the significance test conducted in

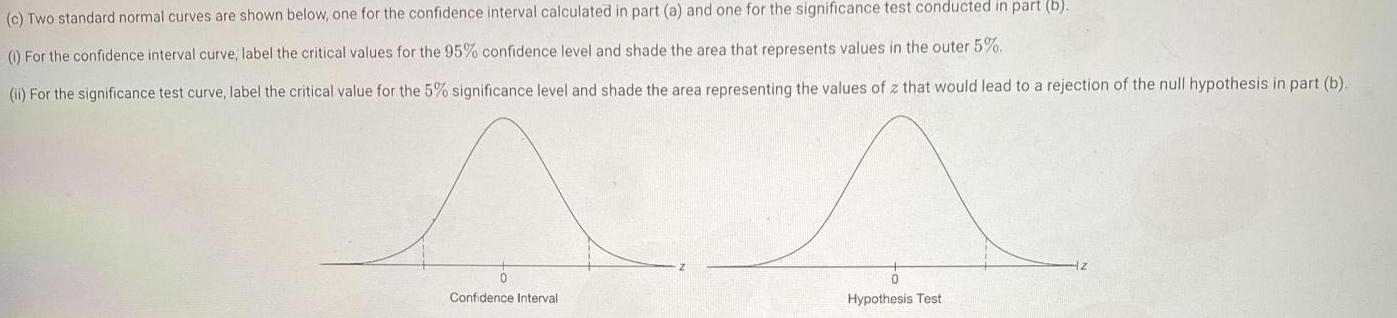
c Two standard normal curves are shown below one for the confidence interval calculated in part a and one for the significance test conducted in part b 1 For the confidence interval curve label the critical values for the 95 confidence level and shade the area that represents values in the outer 5 ii For the significance test curve label the critical value for the 5 significance level and shade the area representing the values of z that would lead to a rejection of the null hypothesis in part b Confidence Interval Hypothesis Test
Step by Step Solution
There are 3 Steps involved in it
Step: 1

Get Instant Access to Expert-Tailored Solutions
See step-by-step solutions with expert insights and AI powered tools for academic success
Step: 2

Step: 3
Ace Your Homework with AI
Get the answers you need in no time with our AI-driven, step-by-step assistance
Get Started
CAD/CAM Systems Planning And Implementation
Authors: Charles S Knox
1st Edition
1000146383, 9781000146387