Answered step by step
Verified Expert Solution
Link Copied!

Question

1 Approved Answer

c. Use the 1.5xIQR rule to determine if the data set for credit card debt for Juniors (Class=3) has any outliers. Show your work and
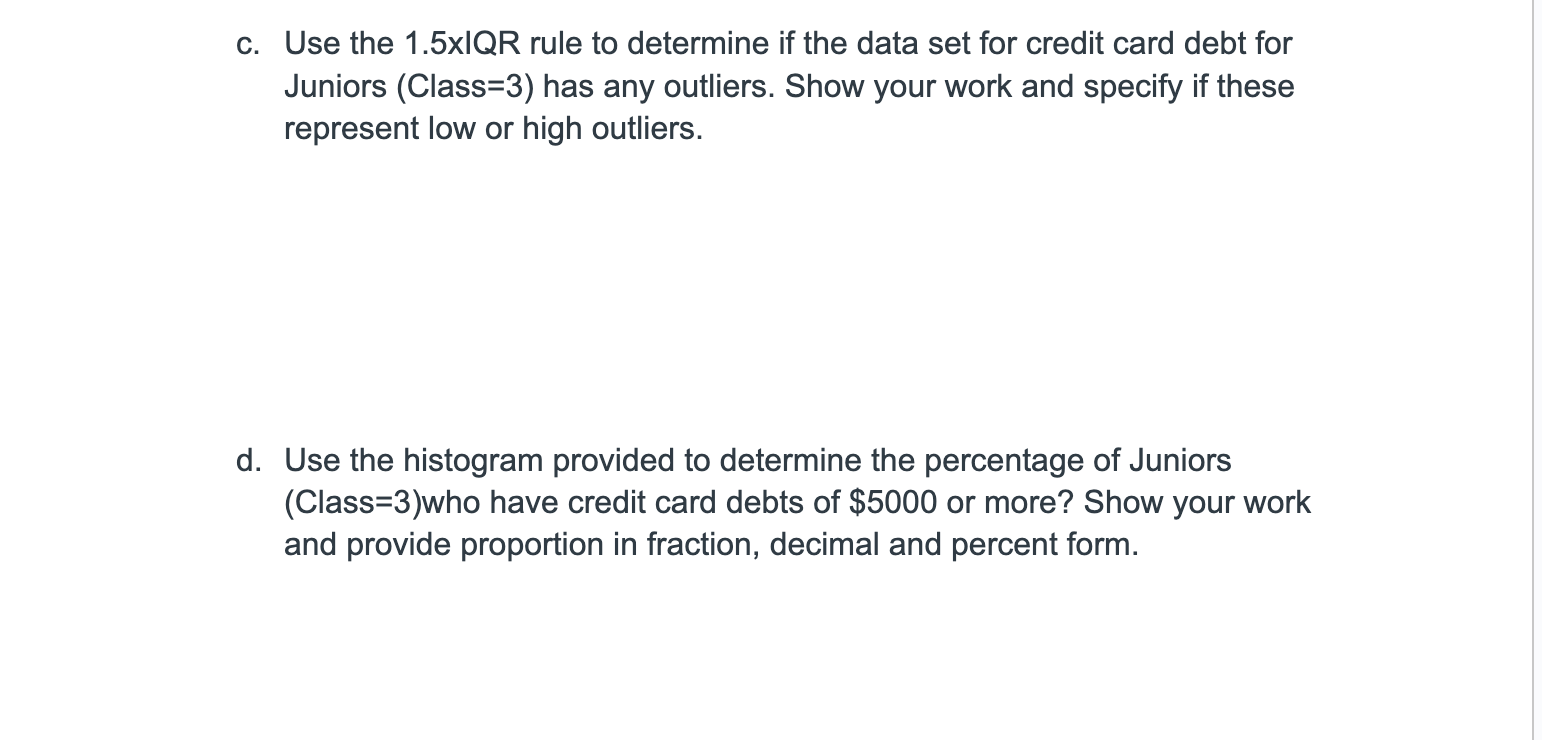
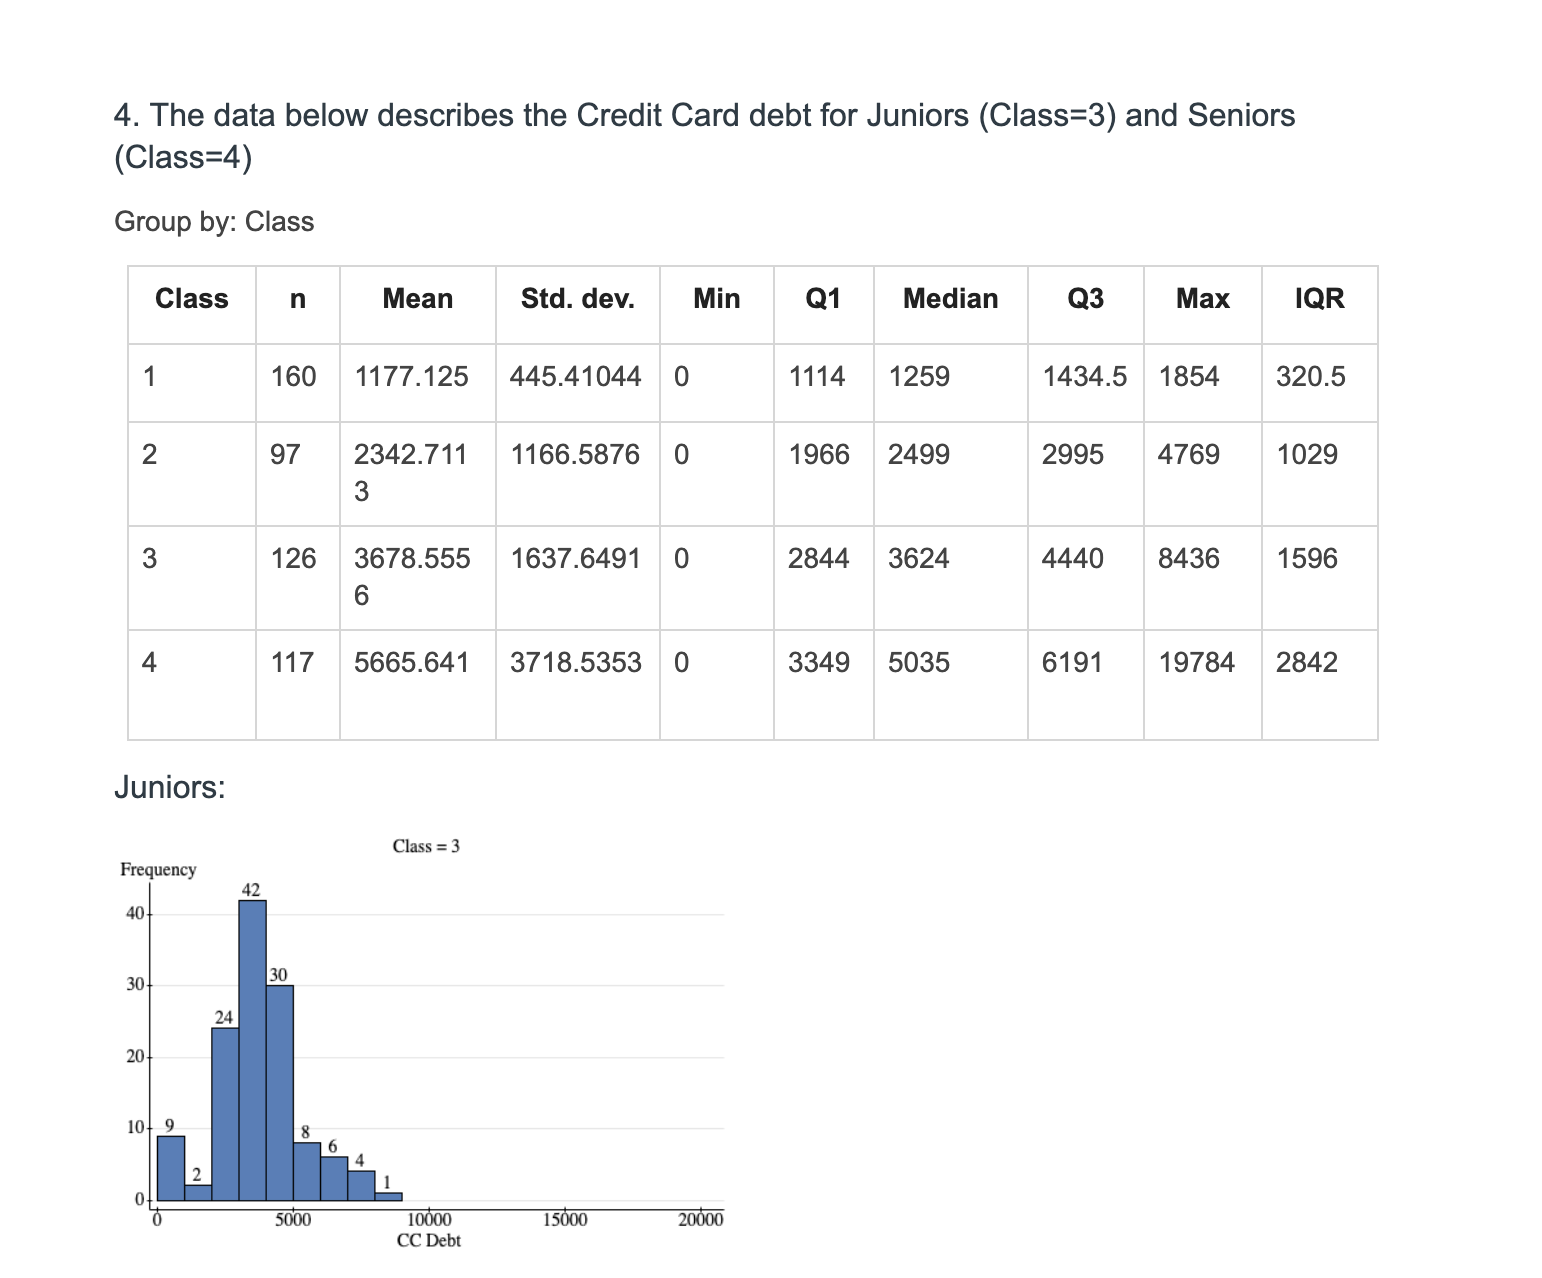
image text in transcribedimage text in transcribedimage text in transcribed
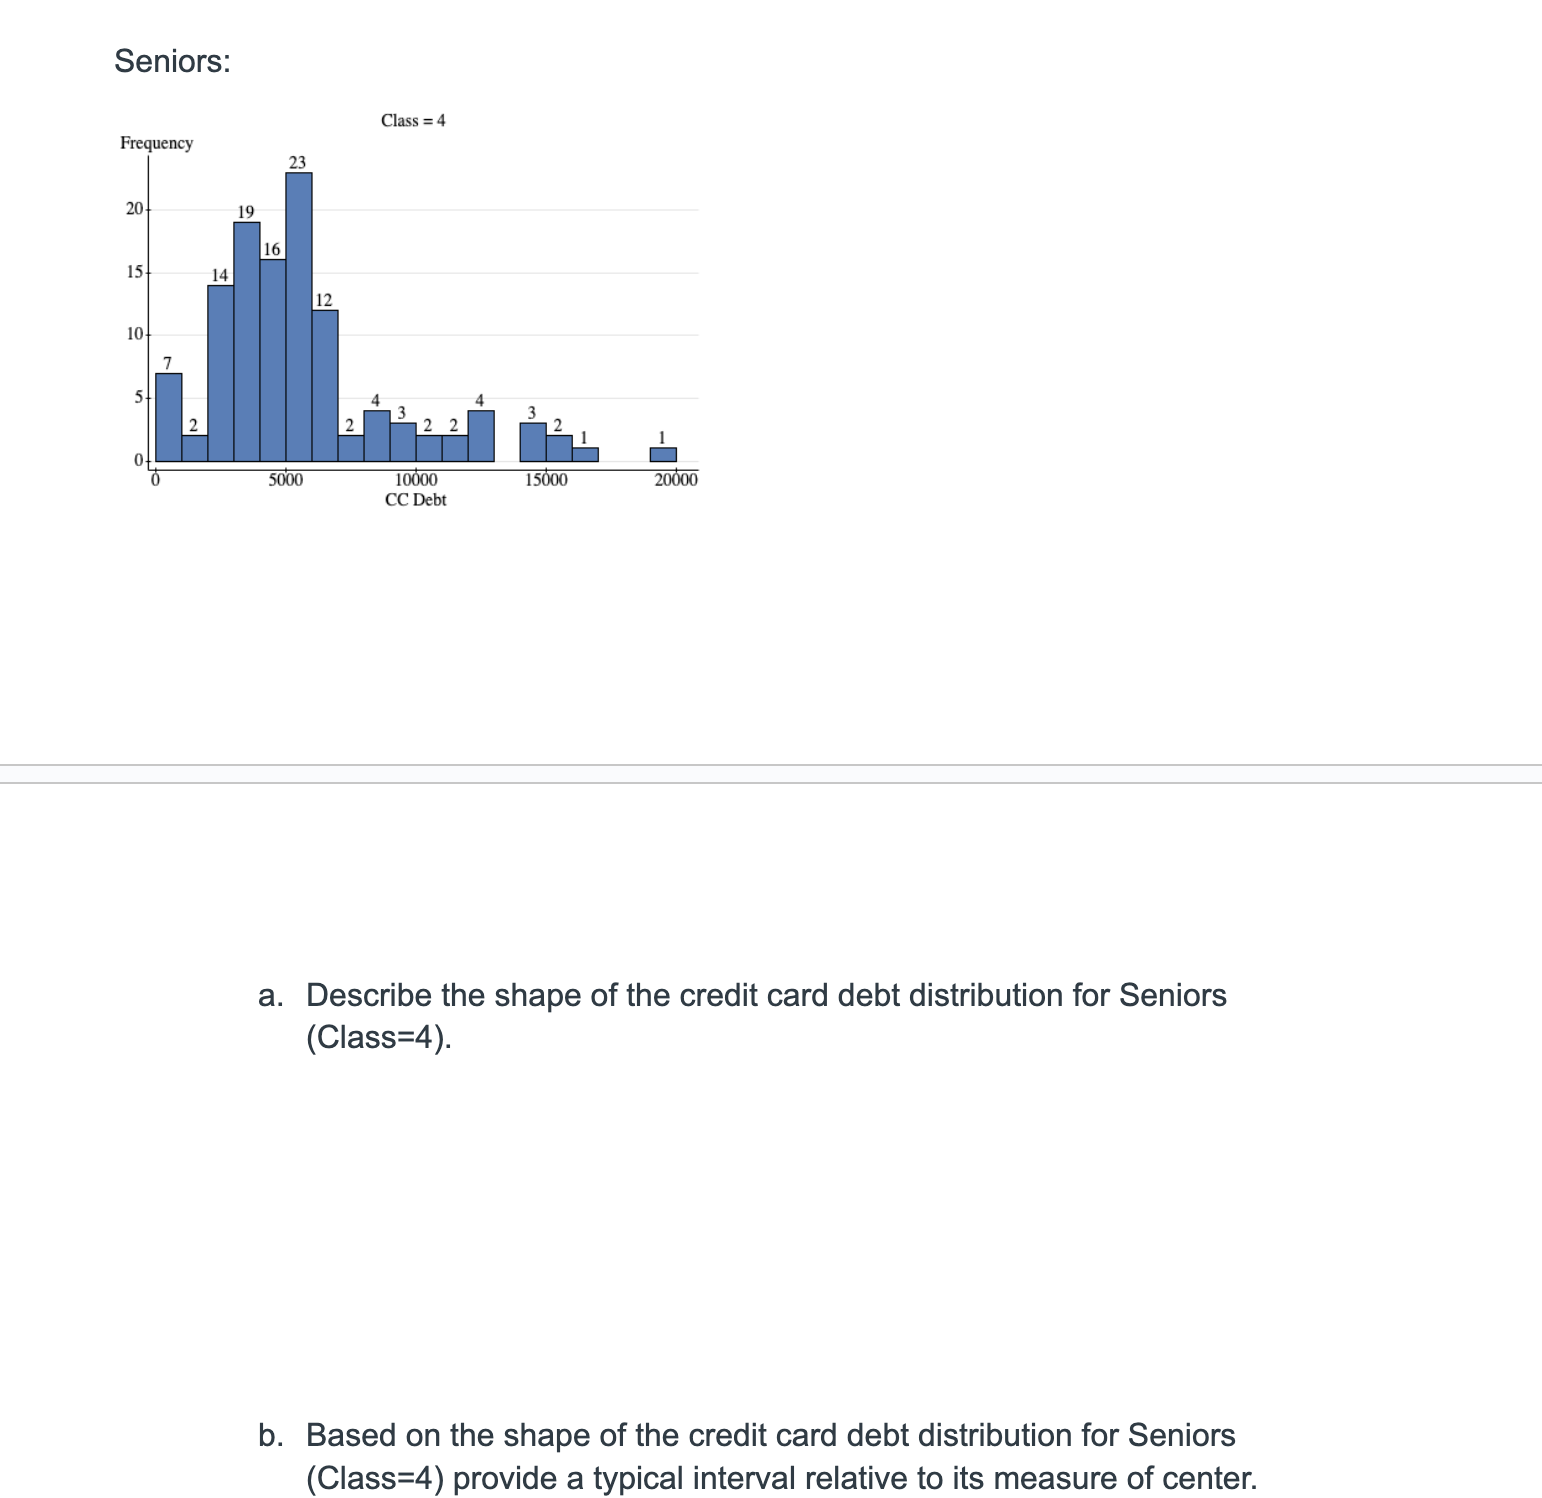
c. Use the 1.5xIQR rule to determine if the data set for credit card debt for Juniors (Class=3) has any outliers. Show your work and specify if these represent low or high outliers. d. Use the histogram provided to determine the percentage of Juniors (Class=3)who have credit card debts of $5000 or more? Show your work and provide proportion in fraction, decimal and percent form. 4. The data below describes the Credit Card debt for Juniors (Class=3) and Seniors (Class=4) Group by: Class Class n 1 160 2 97 3 126 4 117 Juniors: Frequency 1177.125 2342.711 3 3678.555 6 5665.641 Class =3 Std. dev. 445.41044 1166.5876 1637.6491 3718.5353 Min Q1 1114 1966 2844 3349 Median 1259 2499 3624 5035 Q3 1434.5 2995 4440 6191 Max 1854 4769 8436 19784 IQR 320.5 1029 1596 2842 Seniors: Class =4 Frequency a. Describe the shape of the credit card debt distribution for Seniors (Class=4). b. Based on the shape of the credit card debt distribution for Seniors (Class=4) provide a typical interval relative to its measure of center
Step by Step Solution

There are 3 Steps involved in it

Step: 1

blur-text-image

Get Instant Access to Expert-Tailored Solutions

See step-by-step solutions with expert insights and AI powered tools for academic success

Step: 2

blur-text-image

Step: 3

blur-text-image

Ace Your Homework with AI

Get the answers you need in no time with our AI-driven, step-by-step assistance

Get Started

Recommended Textbook for

Elementary Technical Mathematics

Authors: Dale Ewen

12th Edition

1337630586, 978-1337630580

More Books

Students also viewed these Mathematics questions