 c. What are the days cash on hand for the two years? How does that compare to the Moodys 2019 Healthcare Median of 203.5?
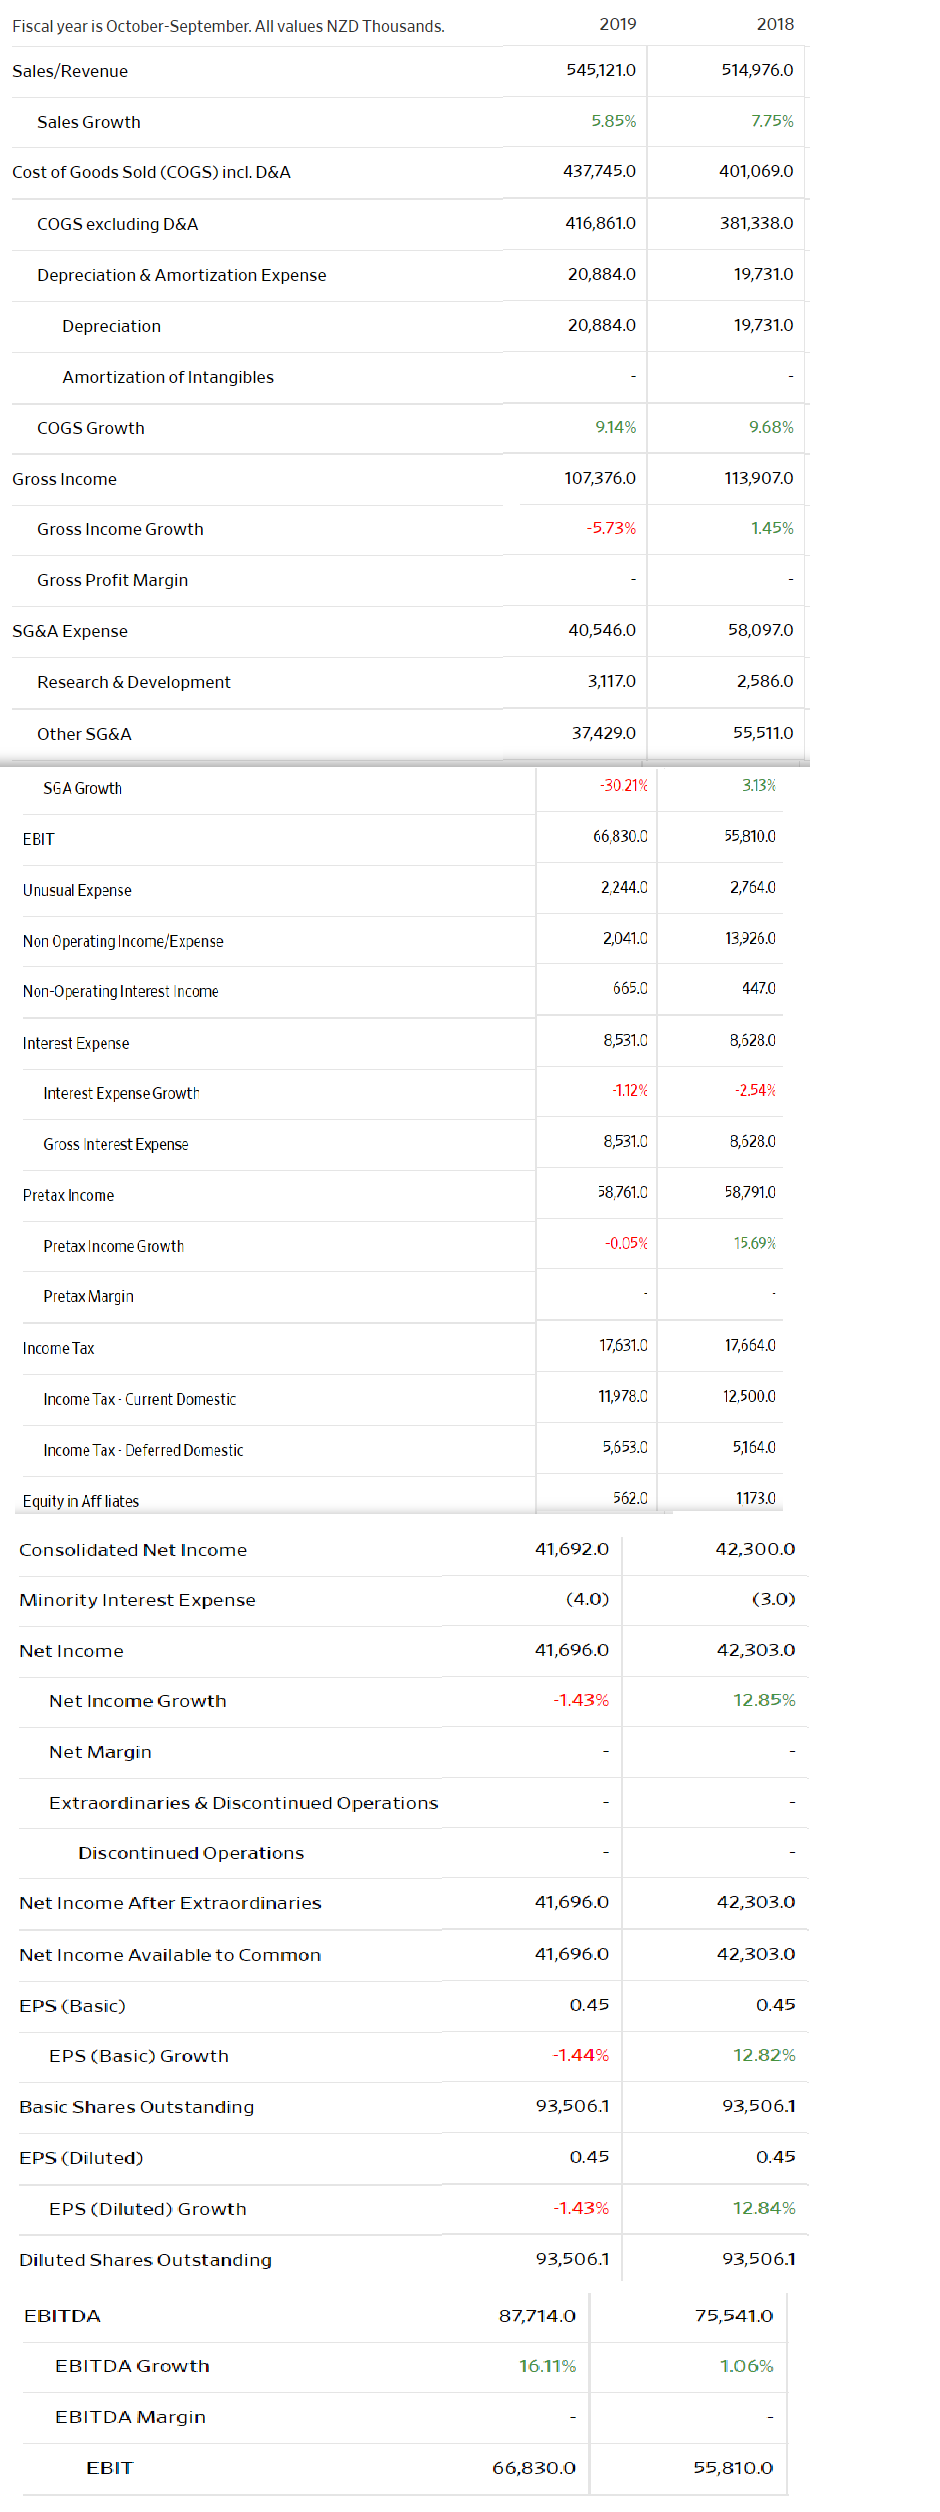
Fiscal year is October September. All values NZD Thousands. 2019 2018 Sales/Revenue 545,121.0 514,976.0 Sales Growth 5.85% 7.75% Cost of Goods Sold (COGS) incl. D&A 437,745.0 401,069.0 COGS excluding D&A 416,861.0 381,338.0 Depreciation & Amortization Expense 20,884.0 19,731.0 Depreciation 20,884.0 19,731.0 Amortization of Intangibles COGS Growth 9.14% 9.68% Gross Income 107,376.0 113,907.0 Gross Income Growth -5.73% 1.45% Gross Profit Margin SG&A Expense 40,546.0 58,097.0 Research & Development 3,117.0 2,586.0 Other SG&A 37,429.0 55,511.0 SGA Growth -30.21% 3.13% EBIT 66,830.0 55,810.0 Unusual Expense 2,244.0 2,764.0 Non Operating Income/Expense 2,041.0 13,926.0 Non-Operating Interest Income 665.0 447.0 Interest Expense 8,531.0 8,628.0 Interest Expense Growth -1.12% -2.54% Gross Interest Expense 8,531.0 8,628.0 Pretax Income 58,761.0 58,791.0 Pretax Income Growth -0.05% 15.69% Pretax Margin Income Tax 17,631.0 17,664.0 Income Tax - Current Domestic 11,978.0 12,500.0 Income Tax-Deferred Domestic 5,653.0 5164.0 Equity in Affliates 562.0 1173.0 Consolidated Net Income 41,692.0 42,300.0 Minority Interest Expense (4.0) (3.0) Net Income 41,696.0 42,303.0 Net Income Growth -1.43% 12.85% Net Margin Extraordinaries & Discontinued Operations Discontinued Operations Net Income After Extraordinaries 41,696.0 42,303.0 Net Income Available to Common 41,696.0 42,303.0 EPS (Basic) 0.45 0.45 EPS (Basic) Growth -1.44% 12.82% Basic Shares Outstanding 93,506.1 93,506.1 EPS (Diluted) 0.45 0.45 EPS (Diluted) Growth -1.43% 12.84% Diluted Shares Outstanding 93,506.1 93,506.1 EBITDA 87,714.0 75,541.0 EBITDA Growth 16.11% 1.06% EBITDA Margin EBIT 66,830.0 55,810.0 Fiscal year is October September. All values NZD Thousands. 2019 2018 Sales/Revenue 545,121.0 514,976.0 Sales Growth 5.85% 7.75% Cost of Goods Sold (COGS) incl. D&A 437,745.0 401,069.0 COGS excluding D&A 416,861.0 381,338.0 Depreciation & Amortization Expense 20,884.0 19,731.0 Depreciation 20,884.0 19,731.0 Amortization of Intangibles COGS Growth 9.14% 9.68% Gross Income 107,376.0 113,907.0 Gross Income Growth -5.73% 1.45% Gross Profit Margin SG&A Expense 40,546.0 58,097.0 Research & Development 3,117.0 2,586.0 Other SG&A 37,429.0 55,511.0 SGA Growth -30.21% 3.13% EBIT 66,830.0 55,810.0 Unusual Expense 2,244.0 2,764.0 Non Operating Income/Expense 2,041.0 13,926.0 Non-Operating Interest Income 665.0 447.0 Interest Expense 8,531.0 8,628.0 Interest Expense Growth -1.12% -2.54% Gross Interest Expense 8,531.0 8,628.0 Pretax Income 58,761.0 58,791.0 Pretax Income Growth -0.05% 15.69% Pretax Margin Income Tax 17,631.0 17,664.0 Income Tax - Current Domestic 11,978.0 12,500.0 Income Tax-Deferred Domestic 5,653.0 5164.0 Equity in Affliates 562.0 1173.0 Consolidated Net Income 41,692.0 42,300.0 Minority Interest Expense (4.0) (3.0) Net Income 41,696.0 42,303.0 Net Income Growth -1.43% 12.85% Net Margin Extraordinaries & Discontinued Operations Discontinued Operations Net Income After Extraordinaries 41,696.0 42,303.0 Net Income Available to Common 41,696.0 42,303.0 EPS (Basic) 0.45 0.45 EPS (Basic) Growth -1.44% 12.82% Basic Shares Outstanding 93,506.1 93,506.1 EPS (Diluted) 0.45 0.45 EPS (Diluted) Growth -1.43% 12.84% Diluted Shares Outstanding 93,506.1 93,506.1 EBITDA 87,714.0 75,541.0 EBITDA Growth 16.11% 1.06% EBITDA Margin EBIT 66,830.0 55,810.0
 c. What are the days cash on hand for the two years? How does that compare to the Moodys 2019 Healthcare Median of 203.5?


