

Answered step by step
Verified Expert Solution
Question
1 Approved Answer
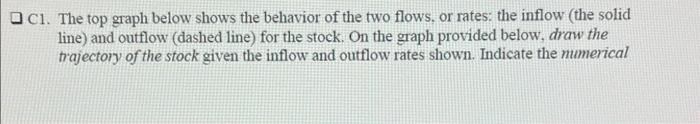
C1. The top graph below shows the behavior of the two flows, or rates: the inflow (the solid line) and outflow (dashed line) for the
Step by Step Solution
There are 3 Steps involved in it
Step: 1

Get Instant Access to Expert-Tailored Solutions
See step-by-step solutions with expert insights and AI powered tools for academic success
Step: 2

Step: 3
Ace Your Homework with AI
Get the answers you need in no time with our AI-driven, step-by-step assistance
Get Started
Financial Innovation Regulation And Crises In History
Authors: Harold James
1st Edition
0367669528, 978-0367669522