

Answered step by step
Verified Expert Solution
Question
1 Approved Answer
- caculate each ratio - Interpret the ratios and comment on the financial condition. - decompose the ROE using DU-Pont Analysis - Compare each component
- caculate each ratio
B D E F G H 1. Current Ratio: 1.84 2. Quick Ratio: 1.84 3. Cash Ratio: 0.00 4. Total Debt Ratio: 1.00 5. Debt-Equity Ratio DIV/0! 6. Equity Multiplier DIV/01 7. Times Interest Eamed Ratio #REFI 8. Cash Coverage Ratio: HREFI 9. Inventory Tumover: #DIV/01 10. Days Sales In Inventory #DIV/0! 11. Receivables Tumover: #DIV/0! 12. Days Sales In Receivables: BDIV/0! 13. Total Asset Turnover: 0.00 14. Capital intensity DIV/0! 15. Profit Margin: NDIV/0! 16. ROA: 0.00 17. ROE: #DIV/0! 18. Price-Eamings Ratio #DIV/01 19. Market-To-Book-Ratio #DIV/01 1 (in Millions) 2 Current Assets: $ 26,171 Cost of Goods Sold 3 Current Liabilities: 14,248 Inventory Turnover 4 Inventory Sales 5 Cash: Accounts Receivable: 6 Total Assets: $ 52,148 Receivables Tumover 7 Total Equity: Net Income: 8 Total Debt Price Per Share: 9 EBIT: Earnings Per Share: 10 Interest: Market Value Per Share: 11 Depreciation: Book Value Per Share: 12 Shares Outstanding 13 14 15 16 17 18 19 20 21 22 DuPont Analysis 23 (in Millions) 2020 (in Millions) 24 Net income: Net Income 25 Sales: 0 Sales: 26 Assets: 52148 Assets: 27 Equity 0 Equity 28 29 ROE (Net Income/Sales) X (Sales/Assets) X (Assets/Equity) 30 ROE #DIV/0! 31 32 Year 33 Component 2019 2018 2017 34 Net Income/Sales #DIV/01 #DIV/01 #DIV/0! Profit Margin 35 Sales/Assets: 0 #DIV/01 #DIV/OITA Tumover 36 Assets/Equity #DIV/0! #DIV/01 #DIV/0! Leverage 37 ROE: #DIV/0 #DIV/0! #DIV/01 38 39 Extended DuPont Analysis 40 ROEEBIT/Sales xEBT/EBITNI/EBT Sales/TAXTA/TE 41 EBIT/Sales #DIV/0! Operating Margin 42 EBT/EBIT #DIV/0! Interest Burden 43 NI/EBT O Tax Burden 44 Sales/TA 45 TA/TE #DIV/01 Leverage 2019 2018 (in Millions) Net Income: Sales: Assets: Equity Measures Operating Efficiency Measures Asset use efficiency Measures Financial leverage Consolidated Balance Sheets (in millions, except per share data) December 31, 2020 December 31, 2019 19,384 1,886 4,101 1.346 26,717 3,091 5,979 12,747 1.558 313 207 1.536 52,148 6,268 1,324 3,552 959 12.103 2,447 6,138 10,396 1,218 339 198 1.470 34,309 3.771 3.222 Assets Current assets Cash and cash equivalents Accounts receivable, nel Inventory Prepaid expenses and other current assets Total current assets Operating loase vehicles, net Solar energy systems, net Property, plant and equipment, net Operating lease right-of-use assets Intangible assets, net Goodwill Other non-current assets Total assets Liabilities Current liabilities Accounts payable Accrued liabilities and other Deferred revenue Customer deposits Current portion of debt and finance leases Total current liabilities Debt and finance cases, net of current portion Deferred revenue, niet of current portion Other long-term liabilities Total liabilities Commitments and contingencies (Note 16) Redeemable noncontrolling interests in subsidiaries Convertible senior notes (Note 12) Equity Stockholders' equity Preferred stock: 0.001 par value; 100 shares authorized; no shares issued and outstanding Common stock: 0.001 par value: 2,000 shares authorized: 960 and 905 shares issued and outstanding as of December 31, 2020 and December 31. 2019, respectively (1) Additional paid-in capital (1) Accumulated other comprehensive income (los) Accumulated deficit Total stockholders' cquity Noncontrolling interests in subsidiaries Total liabilities and equity 6,051 3,855 1.458 752 2,132 14 248 9,556 1,284 3.330 28.418 1,163 726 1.285 10,667 11,634 1,207 2.691 26.199 643 604 51 1 27.260 363 (5,399) 22.225 850 52.148 1 12,736 (36 (6,083 6,618 849 34,209 Tesla, Inc. Consolidated Statements of Operations (in millions, except per share data) Year Ended December 31. 2019 2020 2018 5 S 26.184 1.052 27.236 1.994 2.306 31,536 19,952 869 20.821 1 331 2.226 24,578 17.632 8 18.55 1.355 1.391 21.461 15.939 459 16,398 19.696 563 20.259 1.976 2.671 24.906 6.630 13.686 498 14.174 1.365 1,80 17419 4.042 2,770 20.500 4,069 1.491 3,145 Revenues Automotive sales Automotive leasing Total automotive revenues Energy generation and storage Services and other Total revenues Cost of revenues Automotive sales Automotive leasing Total automotive cost of revenues Energy generation and storage Services and other Total cost of revenues Gross profit Operating expenses Research and development Selling general and administrative Restructuring and other Total operating expenses Income (los) from operations Interest income Interest expense Other (expense) income.net Income (loss) before income taxes Provision for income taxes Net Income (less) Net income (los) attributable to non controlling interests and redeemable no controlling interests in subsidiaries Net Income (less) attributable to common stockholders Les Buyout of controlling interest Net income (los) used in computing net income (los) per share of common stock Net income (lo) per share of common stock attributable to common stockholders (1) Basic Diluted Weighted average shares used in computing net income (los) per share of common stock (1) Basic Diluted 4,636 1.994 30 (748) (122) 1.154 292 862 1343 2,616 149 4.13 (69) 44 (685) 45 (665) 110 (775) 1.460 2,835 135 4430 (388 24 (663 22 (LOOS 58 (1.063 (87 (976 (862 (870) (976 0.74 0.64 (0.9) (0.98 1.14 (1.14 887 933 1.03 853 852 Tesla, Inc. Consolidated Statements of Comprehensive Income (Loss) (in millions) 2020 Year Ended December 31, 2019 862 S (775) 5 2018 (1,063 399 (28 (803) (42 (1.10: 1,261 Net income (loss) Other comprehensive income (loss): Foreign currency translation adjustment Comprehensive income (loss) Less: Comprehensive income (loss) attributable to noncontrolling interests and redeemable noncontrolling interests in subsidiaries Comprehensive income (loss) attributable to common stockholders 141 1,120 87 (890 (87 (1,018 B D E F G H 1. Current Ratio: 1.84 2. Quick Ratio: 1.84 3. Cash Ratio: 0.00 4. Total Debt Ratio: 1.00 5. Debt-Equity Ratio DIV/0! 6. Equity Multiplier DIV/01 7. Times Interest Eamed Ratio #REFI 8. Cash Coverage Ratio: HREFI 9. Inventory Tumover: #DIV/01 10. Days Sales In Inventory #DIV/0! 11. Receivables Tumover: #DIV/0! 12. Days Sales In Receivables: BDIV/0! 13. Total Asset Turnover: 0.00 14. Capital intensity DIV/0! 15. Profit Margin: NDIV/0! 16. ROA: 0.00 17. ROE: #DIV/0! 18. Price-Eamings Ratio #DIV/01 19. Market-To-Book-Ratio #DIV/01 1 (in Millions) 2 Current Assets: $ 26,171 Cost of Goods Sold 3 Current Liabilities: 14,248 Inventory Turnover 4 Inventory Sales 5 Cash: Accounts Receivable: 6 Total Assets: $ 52,148 Receivables Tumover 7 Total Equity: Net Income: 8 Total Debt Price Per Share: 9 EBIT: Earnings Per Share: 10 Interest: Market Value Per Share: 11 Depreciation: Book Value Per Share: 12 Shares Outstanding 13 14 15 16 17 18 19 20 21 22 DuPont Analysis 23 (in Millions) 2020 (in Millions) 24 Net income: Net Income 25 Sales: 0 Sales: 26 Assets: 52148 Assets: 27 Equity 0 Equity 28 29 ROE (Net Income/Sales) X (Sales/Assets) X (Assets/Equity) 30 ROE #DIV/0! 31 32 Year 33 Component 2019 2018 2017 34 Net Income/Sales #DIV/01 #DIV/01 #DIV/0! Profit Margin 35 Sales/Assets: 0 #DIV/01 #DIV/OITA Tumover 36 Assets/Equity #DIV/0! #DIV/01 #DIV/0! Leverage 37 ROE: #DIV/0 #DIV/0! #DIV/01 38 39 Extended DuPont Analysis 40 ROEEBIT/Sales xEBT/EBITNI/EBT Sales/TAXTA/TE 41 EBIT/Sales #DIV/0! Operating Margin 42 EBT/EBIT #DIV/0! Interest Burden 43 NI/EBT O Tax Burden 44 Sales/TA 45 TA/TE #DIV/01 Leverage 2019 2018 (in Millions) Net Income: Sales: Assets: Equity Measures Operating Efficiency Measures Asset use efficiency Measures Financial leverage Consolidated Balance Sheets (in millions, except per share data) December 31, 2020 December 31, 2019 19,384 1,886 4,101 1.346 26,717 3,091 5,979 12,747 1.558 313 207 1.536 52,148 6,268 1,324 3,552 959 12.103 2,447 6,138 10,396 1,218 339 198 1.470 34,309 3.771 3.222 Assets Current assets Cash and cash equivalents Accounts receivable, nel Inventory Prepaid expenses and other current assets Total current assets Operating loase vehicles, net Solar energy systems, net Property, plant and equipment, net Operating lease right-of-use assets Intangible assets, net Goodwill Other non-current assets Total assets Liabilities Current liabilities Accounts payable Accrued liabilities and other Deferred revenue Customer deposits Current portion of debt and finance leases Total current liabilities Debt and finance cases, net of current portion Deferred revenue, niet of current portion Other long-term liabilities Total liabilities Commitments and contingencies (Note 16) Redeemable noncontrolling interests in subsidiaries Convertible senior notes (Note 12) Equity Stockholders' equity Preferred stock: 0.001 par value; 100 shares authorized; no shares issued and outstanding Common stock: 0.001 par value: 2,000 shares authorized: 960 and 905 shares issued and outstanding as of December 31, 2020 and December 31. 2019, respectively (1) Additional paid-in capital (1) Accumulated other comprehensive income (los) Accumulated deficit Total stockholders' cquity Noncontrolling interests in subsidiaries Total liabilities and equity 6,051 3,855 1.458 752 2,132 14 248 9,556 1,284 3.330 28.418 1,163 726 1.285 10,667 11,634 1,207 2.691 26.199 643 604 51 1 27.260 363 (5,399) 22.225 850 52.148 1 12,736 (36 (6,083 6,618 849 34,209 Tesla, Inc. Consolidated Statements of Operations (in millions, except per share data) Year Ended December 31. 2019 2020 2018 5 S 26.184 1.052 27.236 1.994 2.306 31,536 19,952 869 20.821 1 331 2.226 24,578 17.632 8 18.55 1.355 1.391 21.461 15.939 459 16,398 19.696 563 20.259 1.976 2.671 24.906 6.630 13.686 498 14.174 1.365 1,80 17419 4.042 2,770 20.500 4,069 1.491 3,145 Revenues Automotive sales Automotive leasing Total automotive revenues Energy generation and storage Services and other Total revenues Cost of revenues Automotive sales Automotive leasing Total automotive cost of revenues Energy generation and storage Services and other Total cost of revenues Gross profit Operating expenses Research and development Selling general and administrative Restructuring and other Total operating expenses Income (los) from operations Interest income Interest expense Other (expense) income.net Income (loss) before income taxes Provision for income taxes Net Income (less) Net income (los) attributable to non controlling interests and redeemable no controlling interests in subsidiaries Net Income (less) attributable to common stockholders Les Buyout of controlling interest Net income (los) used in computing net income (los) per share of common stock Net income (lo) per share of common stock attributable to common stockholders (1) Basic Diluted Weighted average shares used in computing net income (los) per share of common stock (1) Basic Diluted 4,636 1.994 30 (748) (122) 1.154 292 862 1343 2,616 149 4.13 (69) 44 (685) 45 (665) 110 (775) 1.460 2,835 135 4430 (388 24 (663 22 (LOOS 58 (1.063 (87 (976 (862 (870) (976 0.74 0.64 (0.9) (0.98 1.14 (1.14 887 933 1.03 853 852 Tesla, Inc. Consolidated Statements of Comprehensive Income (Loss) (in millions) 2020 Year Ended December 31, 2019 862 S (775) 5 2018 (1,063 399 (28 (803) (42 (1.10: 1,261 Net income (loss) Other comprehensive income (loss): Foreign currency translation adjustment Comprehensive income (loss) Less: Comprehensive income (loss) attributable to noncontrolling interests and redeemable noncontrolling interests in subsidiaries Comprehensive income (loss) attributable to common stockholders 141 1,120 87 (890 (87 (1,018 - Interpret the ratios and comment on the financial condition.
- decompose the ROE using DU-Pont Analysis
- Compare each component of ROE 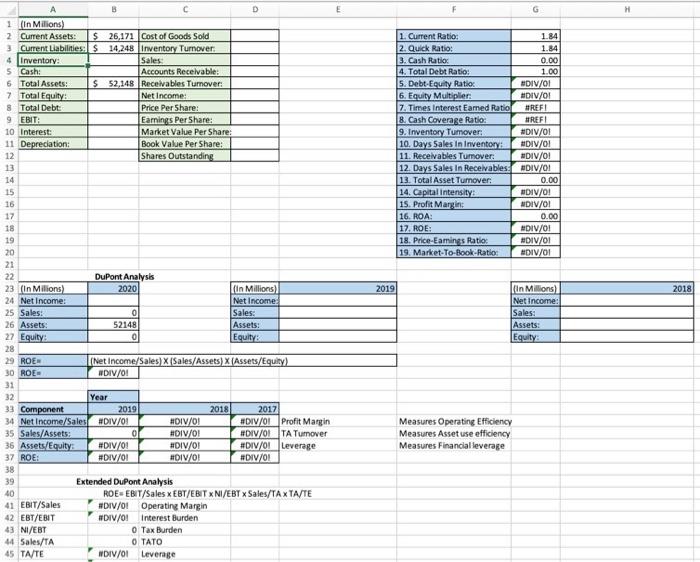
Step by Step Solution
There are 3 Steps involved in it
Step: 1

Get Instant Access to Expert-Tailored Solutions
See step-by-step solutions with expert insights and AI powered tools for academic success
Step: 2

Step: 3
Ace Your Homework with AI
Get the answers you need in no time with our AI-driven, step-by-step assistance
Get Started
Real Estate Finance and Investments
Authors: William Brueggeman, Jeffrey Fisher
14th edition
73377333, 73377339, 978-0073377339