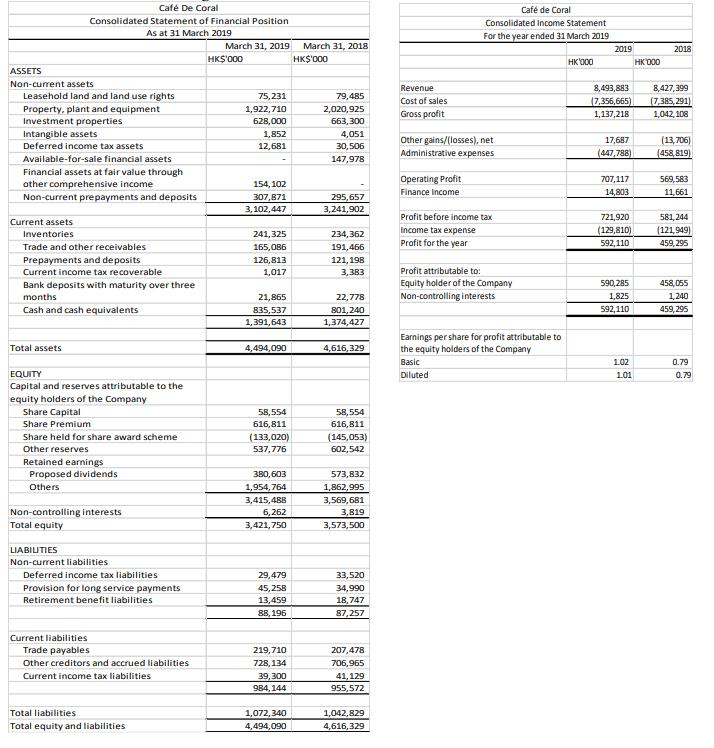
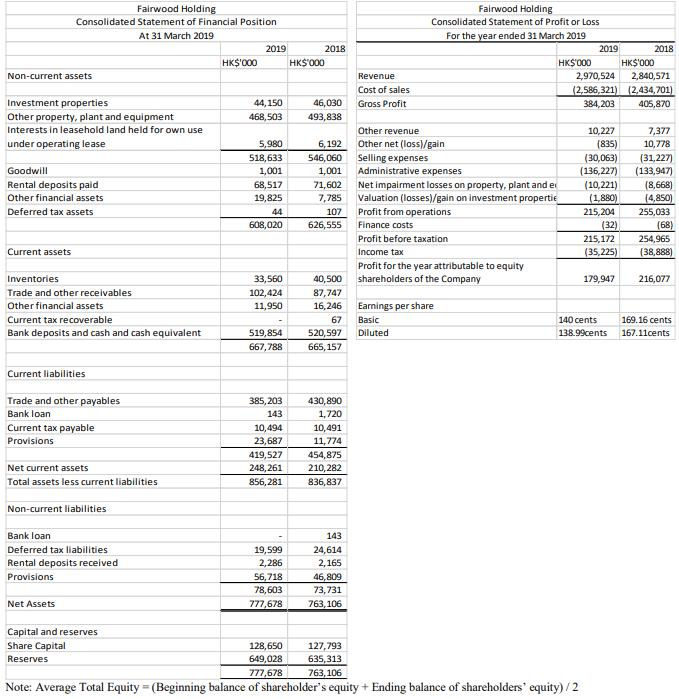
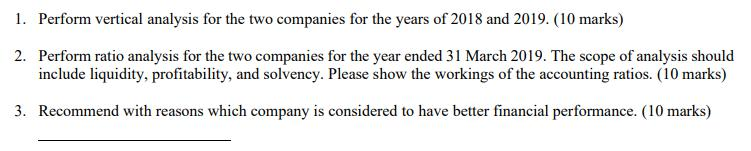
Caf de Coral Consolidated Income Statement For the year ended 31 March 2019 2019 2018 HK 000 HK 000 Revenue Cost of sales Gross profit 8,493,883 17,356,665) 1,137,218 8,427,399 (7,385,291) 1,042, 108 Other gains/(losses), net Administrative expenses 17,687 (447.788) (13,706) (458,819) Caf De Coral Consolidated Statement of Financial Position As at 31 March 2019 March 31, 2019 March 31, 2018 HK$'000 HK$'000 ASSETS Non-current assets Leasehold land and land use rights 75,231 79,485 Property, plant and equipment 1,922,710 2,020,925 Investment properties 628,000 663,300 Intangible assets 1.852 4.051 Deferred income tax assets 12,681 30,506 Available-for-sale financial assets 147,978 Financial assets at fair value through other comprehensive income 154, 102 Non-current prepayments and deposits 307,871 295,657 3.102.447 3.241,902 Current assets Inventories 241,325 234,362 Trade and other receivables 165,086 191,466 Prepayments and deposits 126,813 121, 198 Current income tax recoverable 1,017 3,383 Bank deposits with maturity over three months 21,865 22,778 Cash and cash equivalents 835,537 801.240 1.391.643 1.374,427 Operating Profit Finance Income 707,117 14.803 569,583 11.661 Profit before income tax income tax expense Profit for the vear 721,920 (129,810) 592, 110 581,244 (121,949) 459,295 Profit attributable to: Equity holder of the Company Non-controlling interests 590.285 1,8251 592.110 458,055 ,240 459,295 Total assets 4,494,090 4,616,329 Earnings per share for profit attributable to the equity holders of the Company Basic Diluted 1.02 101 0.79 0.79 EQUITY Capital and reserves attributable to the equity holders of the Company Share Capital Share Premium Share held for share award scheme Other reserves Retained earnings Proposed dividends Others 58,554 616,811 (133,020) 537,776 58,554 616,811 (145,053) 602.542 380,603 1,954,764 3,415,488 6,262 3,421,750 573,832 1,862,995 3,569,681 3,819 3,573,500 Non-controlling interests Total equity LIABILITIES Non-current liabilities Deferred income tax liabilities Provision for long service payments Retirement benefit liabilities 29,479 45,258 13,459 88, 196 33,520 34,990 18,747 87,257 Current liabilities Trade payables Other creditors and accrued liabilities Current income tax liabilities 207,478 706,965 219, 710 728, 134 39,300 984, 144 41,129 955,572 Total liabilities Total equity and liabilities 1,072,340 4.494,090 1,042,829 4.616,329 Fairwood Holding Consolidated Statement of Financial Position At 31 March 2019 2019 2018 HK$'000 HK$ 000 Non-current assets Fairwood Holding Consolidated Statement of Profit or Loss For the year ended 31 March 2019 2019 2018 HK$ 000 HK$'000 2,970,524 2,840,571 (2,586,321) (2,434,701) 384,203 405,870 Revenue Cost of sales Gross Profit 44,150 468,503 46,030 493,838 Investment properties Other property, plant and equipment Interests in leasehold land held for own use under operating lease Goodwill Rental deposits paid Other financial assets Deferred tax assets 5,980 518,633 1,001 68,517 19,825 6,192 546,060 1,001 71,602 7,785 107 626,555 Other revenue Other net (loss/gain Selling expenses Administrative expenses Net impairment losses on property, plant and er Valuation (losses)/gain on investment propertie Profit from operations Finance costs Profit before taxation Income tax Profit for the year attributable to equity shareholders of the Company 10,227 (835) (30,063) (136,227) (10,221) (1,880) 215,204 (32) 215,172 (35,225) 7,377 10,778 (31,227) (133,947) (8,668) (4,850) 255,033 (68) 254.965 (38,888) 608,020 Current assets 179,947 216,077 Inventories Trade and other receivables Other financial assets Current tax recoverable Bank deposits and cash and cash equivalent 33,560 102,424 11,950 40,500 87,747 16,246 67 520,597 665, 157 Earnings per share Basic Diluted 140 cents 138.99cents 169.16 cents 167.11cents 519,854 667,788 Current liabilities Trade and other payables Bank loan Current tax payable Provisions 385,203 143 10,494 23,687 419,527 248,261 856,281 430,890 1,720 10,491 11,774 454.875 210,282 836,837 Net current assets Total assets less current liabilities Non-current liabilities Bank loan Deferred tax liabilities Rental deposits received Provisions 19,599 2,286 56,718 78,603 777,678 143 24,614 2,165 46,809 73,731 763,106 Net Assets Capital and reserves Share Capital 128,650 127,793 Reserves 649,028 635,313 777,678 763, 106 Note: Average Total Equity =(Beginning balance of shareholder's equity + Ending balance of shareholders' equity)/2 1. Perform vertical analysis for the two companies for the years of 2018 and 2019. (10 marks) 2. Perform ratio analysis for the two companies for the year ended 31 March 2019. The scope of analysis should include liquidity, profitability, and solvency. Please show the workings of the accounting ratios. (10 marks) 3. Recommend with reasons which company is considered to have better financial performance. (10 marks) Caf de Coral Consolidated Income Statement For the year ended 31 March 2019 2019 2018 HK 000 HK 000 Revenue Cost of sales Gross profit 8,493,883 17,356,665) 1,137,218 8,427,399 (7,385,291) 1,042, 108 Other gains/(losses), net Administrative expenses 17,687 (447.788) (13,706) (458,819) Caf De Coral Consolidated Statement of Financial Position As at 31 March 2019 March 31, 2019 March 31, 2018 HK$'000 HK$'000 ASSETS Non-current assets Leasehold land and land use rights 75,231 79,485 Property, plant and equipment 1,922,710 2,020,925 Investment properties 628,000 663,300 Intangible assets 1.852 4.051 Deferred income tax assets 12,681 30,506 Available-for-sale financial assets 147,978 Financial assets at fair value through other comprehensive income 154, 102 Non-current prepayments and deposits 307,871 295,657 3.102.447 3.241,902 Current assets Inventories 241,325 234,362 Trade and other receivables 165,086 191,466 Prepayments and deposits 126,813 121, 198 Current income tax recoverable 1,017 3,383 Bank deposits with maturity over three months 21,865 22,778 Cash and cash equivalents 835,537 801.240 1.391.643 1.374,427 Operating Profit Finance Income 707,117 14.803 569,583 11.661 Profit before income tax income tax expense Profit for the vear 721,920 (129,810) 592, 110 581,244 (121,949) 459,295 Profit attributable to: Equity holder of the Company Non-controlling interests 590.285 1,8251 592.110 458,055 ,240 459,295 Total assets 4,494,090 4,616,329 Earnings per share for profit attributable to the equity holders of the Company Basic Diluted 1.02 101 0.79 0.79 EQUITY Capital and reserves attributable to the equity holders of the Company Share Capital Share Premium Share held for share award scheme Other reserves Retained earnings Proposed dividends Others 58,554 616,811 (133,020) 537,776 58,554 616,811 (145,053) 602.542 380,603 1,954,764 3,415,488 6,262 3,421,750 573,832 1,862,995 3,569,681 3,819 3,573,500 Non-controlling interests Total equity LIABILITIES Non-current liabilities Deferred income tax liabilities Provision for long service payments Retirement benefit liabilities 29,479 45,258 13,459 88, 196 33,520 34,990 18,747 87,257 Current liabilities Trade payables Other creditors and accrued liabilities Current income tax liabilities 207,478 706,965 219, 710 728, 134 39,300 984, 144 41,129 955,572 Total liabilities Total equity and liabilities 1,072,340 4.494,090 1,042,829 4.616,329 Fairwood Holding Consolidated Statement of Financial Position At 31 March 2019 2019 2018 HK$'000 HK$ 000 Non-current assets Fairwood Holding Consolidated Statement of Profit or Loss For the year ended 31 March 2019 2019 2018 HK$ 000 HK$'000 2,970,524 2,840,571 (2,586,321) (2,434,701) 384,203 405,870 Revenue Cost of sales Gross Profit 44,150 468,503 46,030 493,838 Investment properties Other property, plant and equipment Interests in leasehold land held for own use under operating lease Goodwill Rental deposits paid Other financial assets Deferred tax assets 5,980 518,633 1,001 68,517 19,825 6,192 546,060 1,001 71,602 7,785 107 626,555 Other revenue Other net (loss/gain Selling expenses Administrative expenses Net impairment losses on property, plant and er Valuation (losses)/gain on investment propertie Profit from operations Finance costs Profit before taxation Income tax Profit for the year attributable to equity shareholders of the Company 10,227 (835) (30,063) (136,227) (10,221) (1,880) 215,204 (32) 215,172 (35,225) 7,377 10,778 (31,227) (133,947) (8,668) (4,850) 255,033 (68) 254.965 (38,888) 608,020 Current assets 179,947 216,077 Inventories Trade and other receivables Other financial assets Current tax recoverable Bank deposits and cash and cash equivalent 33,560 102,424 11,950 40,500 87,747 16,246 67 520,597 665, 157 Earnings per share Basic Diluted 140 cents 138.99cents 169.16 cents 167.11cents 519,854 667,788 Current liabilities Trade and other payables Bank loan Current tax payable Provisions 385,203 143 10,494 23,687 419,527 248,261 856,281 430,890 1,720 10,491 11,774 454.875 210,282 836,837 Net current assets Total assets less current liabilities Non-current liabilities Bank loan Deferred tax liabilities Rental deposits received Provisions 19,599 2,286 56,718 78,603 777,678 143 24,614 2,165 46,809 73,731 763,106 Net Assets Capital and reserves Share Capital 128,650 127,793 Reserves 649,028 635,313 777,678 763, 106 Note: Average Total Equity =(Beginning balance of shareholder's equity + Ending balance of shareholders' equity)/2 1. Perform vertical analysis for the two companies for the years of 2018 and 2019. (10 marks) 2. Perform ratio analysis for the two companies for the year ended 31 March 2019. The scope of analysis should include liquidity, profitability, and solvency. Please show the workings of the accounting ratios. (10 marks) 3. Recommend with reasons which company is considered to have better financial performance. (10 marks)


