

Answered step by step
Verified Expert Solution
Question
1 Approved Answer
Calcuate WACC (weighted average cost of capital) and terminal Loss EXHIBIT 1 Heritage Foods Income Statement For the Year Ended Dec 31 EXHIBIT 2 Heritage
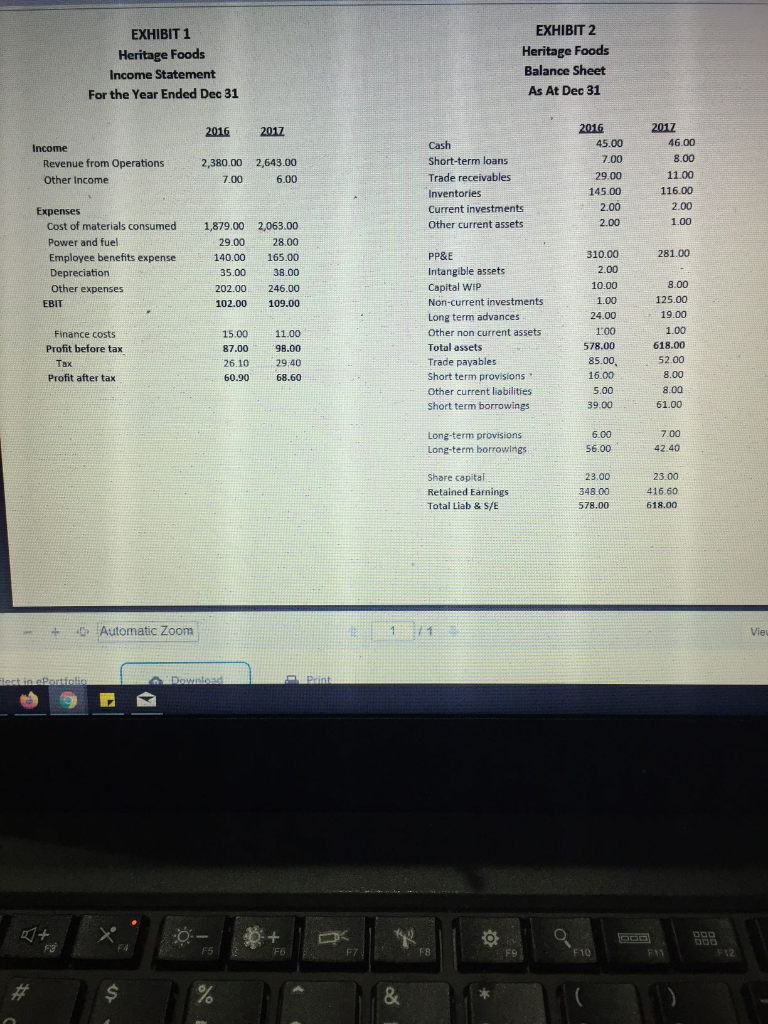
Calcuate WACC (weighted average cost of capital) and terminal Loss
EXHIBIT 1 Heritage Foods Income Statement For the Year Ended Dec 31 EXHIBIT 2 Heritage Foods Balance Sheet As At Dec 31 2016 2017 Income Revenue from Operations Other Income 2,380.00 2,643.00 7.00 6.00 Cash Short-term loans Trade receivables Inventories Current investments Other current assets 2016 45.00 7.00 29.00 145.00 2.00 2.00 2017 46.00 8.00 11.00 116.00 2.00 1.00 Expenses Cost of materials consumed Power and fuel Employee benefits expense Depreciation Other expenses EBIT 281.00 1,879.00 29.00 140.00 35.00 202.00 102.00 2,063.00 28.00 165.00 38.00 246.00 109.00 310.00 2.00 10.00 1.00 24.00 Finance costs Profit before tax 100 15.00 87.00 26.10 60.90 PP&E Intangible assets Capital WIP Non-current investments Long term advances Other non current assets Total assets Trade payables Short term provisions Other current liabilities Short term borrowings 11.00 98.00 29.40 68.60 8.00 125.00 19.00 1.00 618.00 52.00 8.00 8.00 61.00 578.00 85.00 16.00 5.00 39.00 Profit after tax Long-term provisions Long-term borrowings 6.00 56.00 7.00 42.40 Share capital Retained Earnings Total Liab & S/E 23.00 348 00 578.00 23.00 416 60 618.00 + Automatic Zoom Vies lentin Portfolio Download 000 F10 EXHIBIT 1 Heritage Foods Income Statement For the Year Ended Dec 31 EXHIBIT 2 Heritage Foods Balance Sheet As At Dec 31 2016 2017 Income Revenue from Operations Other Income 2,380.00 2,643.00 7.00 6.00 Cash Short-term loans Trade receivables Inventories Current investments Other current assets 2016 45.00 7.00 29.00 145.00 2.00 2.00 2017 46.00 8.00 11.00 116.00 2.00 1.00 Expenses Cost of materials consumed Power and fuel Employee benefits expense Depreciation Other expenses EBIT 281.00 1,879.00 29.00 140.00 35.00 202.00 102.00 2,063.00 28.00 165.00 38.00 246.00 109.00 310.00 2.00 10.00 1.00 24.00 Finance costs Profit before tax 100 15.00 87.00 26.10 60.90 PP&E Intangible assets Capital WIP Non-current investments Long term advances Other non current assets Total assets Trade payables Short term provisions Other current liabilities Short term borrowings 11.00 98.00 29.40 68.60 8.00 125.00 19.00 1.00 618.00 52.00 8.00 8.00 61.00 578.00 85.00 16.00 5.00 39.00 Profit after tax Long-term provisions Long-term borrowings 6.00 56.00 7.00 42.40 Share capital Retained Earnings Total Liab & S/E 23.00 348 00 578.00 23.00 416 60 618.00 + Automatic Zoom Vies lentin Portfolio Download 000 F10Step by Step Solution
There are 3 Steps involved in it
Step: 1

Get Instant Access to Expert-Tailored Solutions
See step-by-step solutions with expert insights and AI powered tools for academic success
Step: 2

Step: 3
Ace Your Homework with AI
Get the answers you need in no time with our AI-driven, step-by-step assistance
Get Started
Contemporary Issues In Behavioral Finance
Authors: Simon Grima
1st Edition
1787698823, 978-1787698826