Answered step by step
Verified Expert Solution
Question
1 Approved Answer
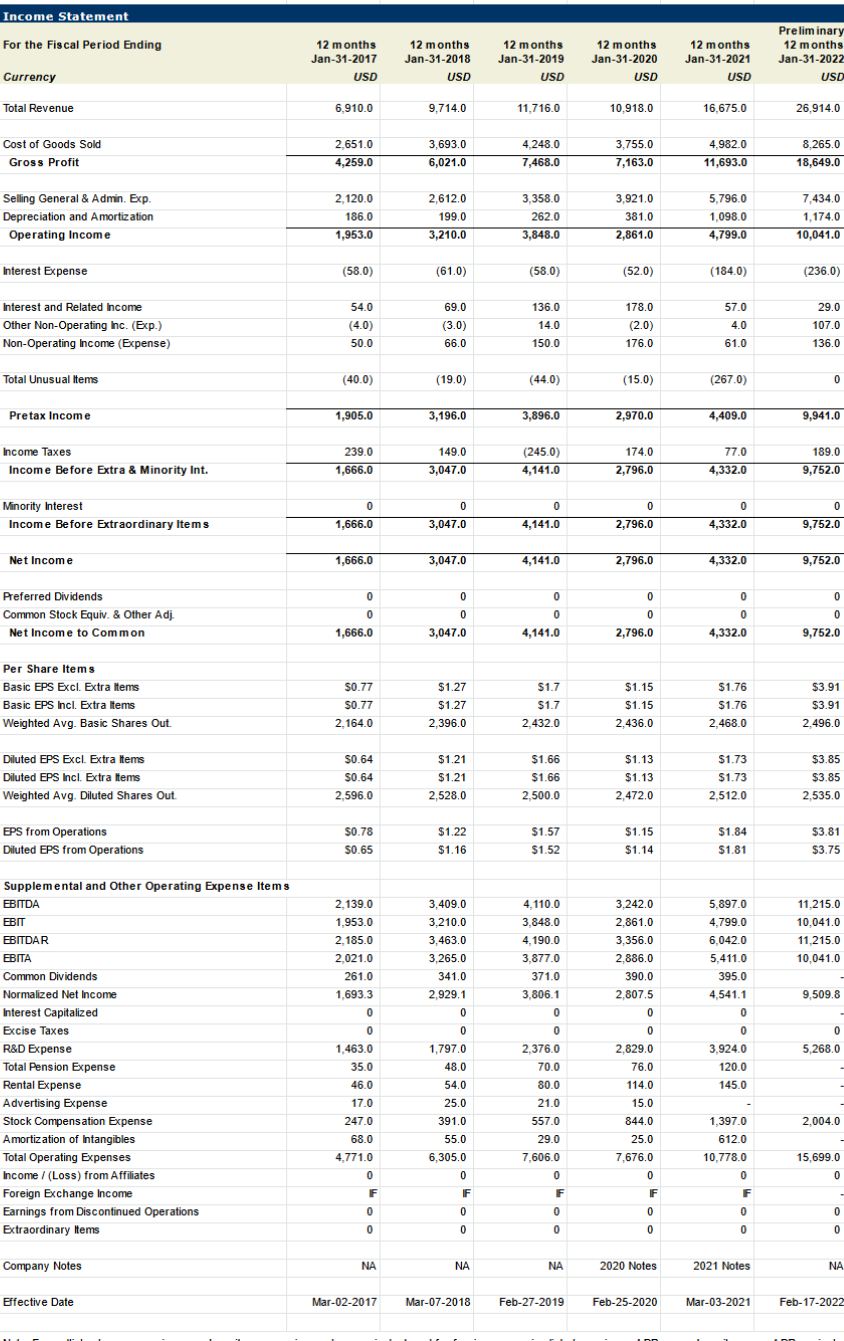
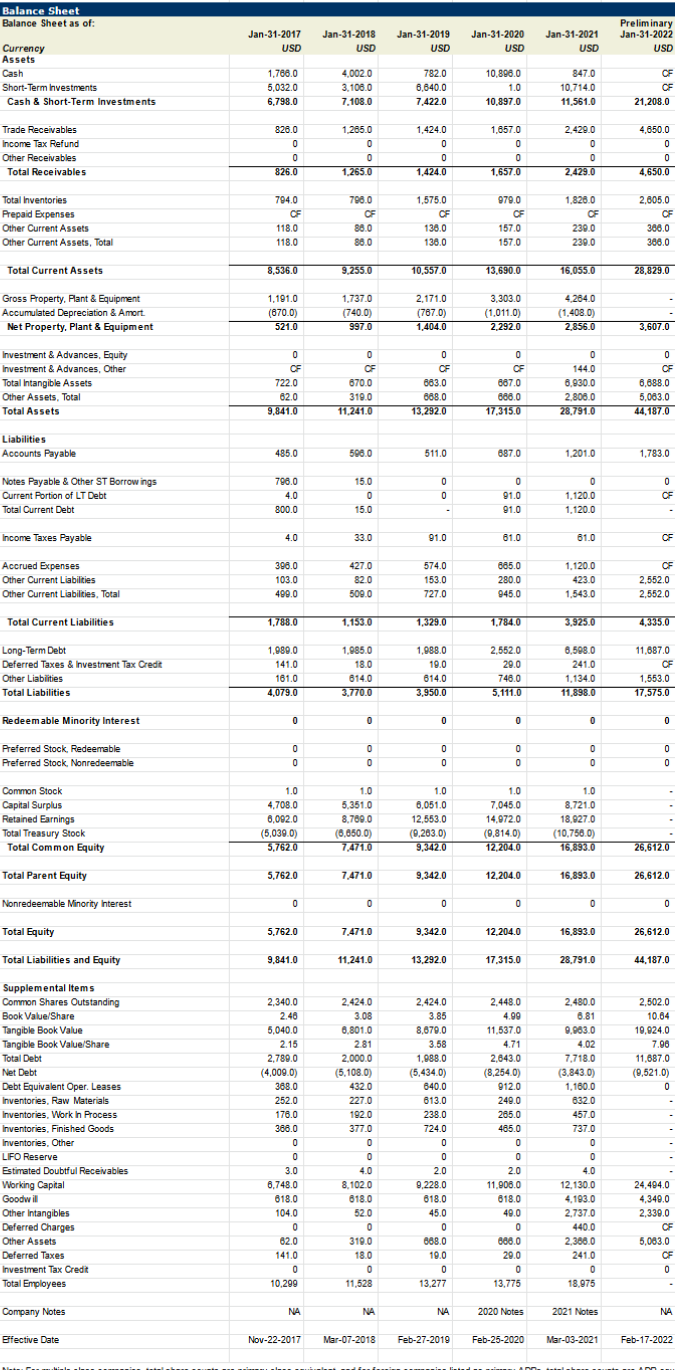
Calculate 8 ratios for the most recent 5 years (these 8 ratios are current ratio; inventory turnover; receivables turnover; total asset turnover; profit margin; equity


Calculate 8 ratios for the most recent 5 years (these 8 ratios are current ratio; inventory turnover; receivables turnover; total asset turnover; profit margin; equity multiplier; return on asset; return on equity), and think about the trends
Income Statement For the Fiscal Period Ending 12 months Jan-31-2017 USD 12 months Jan-31-2018 USD 12 months Jan-31-2019 USD 12 months Jan-31-2020 USD 12 months Jan-31-2021 USD Preliminary 12 months Jan-31-2022 USD Currency Total Revenue 6.910.0 9.714.0 11.716.0 10,918.0 16,675.0 26.914.0 Cost of Goods Sold Gross Profit 2,651.0 4,259.0 3,693.0 6,021.0 4.248.0 7,468.0 3,755.0 7,163.0 4.982.0 11,693.0 8,265.0 18,649.0 Selling General & Admin. Exp. Depreciation and Amortization Operating Income 2,120.0 186.0 1,953.0 2,612.0 199.0 3,210.0 3,358.0 262.0 3,848.0 3,921.0 381.0 2,861.0 5,796.0 1,098.0 4,799.0 7,434.0 1,174.0 10,041.0 Interest Expense (58.0) (61.0) (58.0) (52.0) (1840) (236.0) 136.0 Interest and Related Income Other Non-Operating Inc. (Exp.) Non-Operating Income (Expense) 54.0 (4.0) 50.0 69.0 (3.0) 66.0 178.0 (2.0) 176.0 57.0 4.0 14.0 150.0 29.0 107.0 136.0 61.0 Total Unusual Items (40.0) (19.0) (44.0) (15.0) (267.0) 0 Pretax Income 1,905.0 3,196.0 3,896.0 2,970.0 4,409.0 9,941.0 Income Taxes Income Before Extra & Minority Int. 239.0 1,666.0 149.0 3,047.0 (245.0) 4,141.0 174.0 2,796.0 77.0 4,332.0 189.0 9,752.0 0 Minority Interest Income Before Extraordinary Items 0 1,666.0 0 3,047.0 0 4.141.0 0 2,796.0 0 9,752.0 4,332.0 Net Income 1,666.0 3,047.0 4,141.0 2,796.0 4,332.0 9,752.0 0 0 0 0 0 0 Preferred Dividends Common Stock Equiv. & Other Adj. . Net Income to Common 0 0 1,666.0 0 0 4,141.0 0 3,047.0 0 0 2,796.0 0 4,332.0 9,752.0 $1.76 Per Share Items Basic EPS Excl. Extra Items Basic EPS Incl. Extra Items Weighted Avg. Basic Shares Out. $0.77 $0.77 2.164.0 $1.27 $1.27 2,396.0 $1.7 $1.7 2.432.0 $1.15 $1.15 2,436.0 $1.76 2,468.0 $3.91 $3.91 2.496.0 $1.73 Diluted EPS Excl. Extra items Diluted EPS Incl. Extra items Weighted Avg. Diluted Shares Out. $0.64 $0.64 2.596.0 $1.21 $1.21 2,528.0 $1.66 $1.66 2.500.0 $1.13 $1.13 2,472.0 $1.73 2,512.0 $3.85 $3.85 2.535.0 $1.22 $3.81 EPS from Operations Diluted EPS from Operations $0.78 $0.65 $1.57 $1.52 $1.15 $1.14 $1.84 $1.81 $1.16 $3.75 3,409.0 3.210.0 3,463.0 3,265.0 341.0 2.929.1 0 0 3,242.0 2.861.0 3,356.0 2.886.0 390.0 2.807.5 11,215.0 10.041.0 11,215.0 10,041.0 5,897.0 4,799.0 6.042.0 5,411.0 395.0 4.541.1 4.110.0 3.848.0 4.190.0 3.877.0 371.0 3,806.1 0 0 2.376.0 70.0 80.0 9.509.8 0 2.139.0 1.953.0 2.185.0 2.021.0 261.0 1,693.3 0 0 1,463.0 35.0 46.0 17.0 247.0 68.0 4.771.0 0 0 0 Supplemental and Other Operating Expense Items EBITDA EBIT EBITDAR EBITA Common Dividends Normalized Net Income Interest Capitalized Excise Taxes R&D Expense Total Pension Expense Rental Expense Advertising Expense Stock Compensation Expense Amortization of Intangibles Total Operating Expenses Income /(Loss) from Affiliates ( Foreign Exchange Income Earnings from Discontinued Operations Extraordinary Items 0 2,829.0 5,268.0 0 3,924.0 120.0 145.0 76.0 114.0 15.0 844.0 2.004.0 1,797.0 48.0 54.0 25.0 391.0 55.0 6,305.0 0 IF 0 21.0 557.0 29.0 7,606.0 0 F 25.0 7,676.0 1,397.0 6120 10.778.0 15,699.0 0 0 0 0 F F 0 0 F 0 0 0 0 0 0 0 0 0 0 0 0 0 Company Notes NA NA NA 2020 Notes 2021 Notes NA Effective Date Mar-02-2017 Mar-07-2018 Feb-27-2019 Feb-25-2020 Mar-03-2021 Feb-17-2022 Balance Sheet Balance Sheet as of: Jan-31-2017 USD Jan-31-2018 USD Jan-31-2019 USD Jan-31-2020 USD Jan-31-2021 USD Preliminary Jan-31-2022 USD Currency Assets Cash Short-Term Investments Cash & Short-Term Investments 1,786.0 5,0320 6.798.0 4.002.0 3.108.0 7,108.0 782.0 6,640.0 7.422.0 10.898.0 1.0 10.897.0 847.0 10.7140 11,561.0 OF OF 21,208.0 Trade Receivables Income Tax Refund Other Receivables Total Receivables 828.0 0 0 0 826.0 1.285.0 0 0 0 0 1.265.0 1,424.0 0 0 1,424.0 1,657.0 0 0 0 0 1,657.0 2.429.0 0 0 2.429.0 4,650.0 0 0 4,650.0 1.828.0 Total Inventories Prepaid Expenses Other Current Assets Other Current Assets, Total 794.0 CF 118.0 118.0 798.0 OF 86.0 860 1,575.0 CF 136.0 136.0 979.0 OF 157.0 157.0 2,605.0 CF 380.0 380.0 239.0 230.0 Total Current Assets 8,536.0 9.255.0 10,557.0 13,690.0 16.055.0 28,829.0 Gross Property. Plant & Equipment Accumulated Depreciation & Amort. Net Property. Plant & Equipment 1,191.0 (670.0) 521.0 1,737.0 (740.0) 997.0 2.171.0 (787.0) 1,404.0 3,303.0 (1.011.0) 2.292.0 4.284.0 (1.408.0) 2.856.0 3,607.0 Investment & Advances, Equity Investment & Advances, Other Total Intangible Assets Other Assets, Total Total Assets 0 OF 722.0 82.0 9,841.0 0 OF 6700 319.0 11.241.0 0 CF 883.0 688.0 13.292.0 0 OF 887.0 888.0 17,315.0 0 144.0 6.930.0 2.806.0 28,791.0 0 OF 8,888.0 5,083.0 44,187.0 Liabilities Accounts Payable 485.0 598.0 511.0 687.0 1,201.0 1,783.0 Notes Payable & Other ST Borrowings Current Portion of LT Debt Total Current Debt 790.0 4.0 800.0 15.0 0 0 15.0 0 0 . 0 0 91.0 91.0 0 1,120.0 1,120.0 0 CF Income Taxes Payable 4.0 33.0 91.0 61.0 61.0 OF Accrued Expenses Other Current Liabilities Other Current Liabilities. Total 398.0 103.0 499.0 427.0 82.0 509.0 574.0 153.0 727.0 665.0 280.0 945.0 1.120.0 423.0 1.543.0 OF 2,552.0 2.552.0 Total Current Liabilities 1,788.0 1.153.0 1,329.0 1.784.0 3,5250 4,335.0 Long-Term Debt Deferred Taxes & Investment Tax Credit Other Liabilities Total Liabilities 1,980.0 141.0 181.0 4,079.0 1,985.0 18.0 614.0 3.770.0 1,988.0 19.0 614.0 3,950.0 2,552.0 29.0 746.0 5.1110 6,508.0 241.0 1,134,0 11.898.0 11,887,0 CF 1,553.0 17,575.0 Redeemable Minority Interest 0 0 0 0 0 0 Preferred Stock, Redeemable Preferred Stock, Nonredeemable 0 0 0 0 0 0 0 0 0 0 0 0 0 Common Stock Capital Surplus Retained Earnings Total Treasury Stock Total Common Equity 1.0 4,708.0 6.092.0 (5,030.0) 5,762.0 1.0 5.351.0 8,780.0 (6.650,0) 7,471,0 1.0 6.051.0 12.553.0 (0,203.0) 9,342.0 1.0 7.045.0 14,9720 (0,814.0) 12,204.0 1.0 8,721.0 18,927.0 (10.750.0) 16,893.0 26,6120 Total Parent Equity 5,762.0 7,471.0 9,3420 12,204.0 16,893.0 26,612.0 Nonredeemable Minority interest 0 0 0 0 0 0 Total Equity 5.762.0 7,471.0 9,342.0 12,204.0 16.893.0 26,612.0 Total Liabilities and Equity 9,841.0 11.241.0 13,292.0 17.315.0 28.791.0 44,187.0 2.502.0 10.64 10,024.0 7.96 11.687.0 (0,521.0) 0 Supplemental Items Common Shares Outstanding Book Value/Share Tangible Book Value Tangible Book Value/Share Total Debt Net Debt Debt Equivalent Oper. Leases Inventories, Raw Materials Inventories, Work in Process Inventories, Finished Goods Inventories. Other LIFO Reserve Estimated Doubtful Receivables Working Capital Goodwill Other Intangibles Deferred Charges Other Assets Deferred Taxes Investment Tax Credit Total Employees 2.340.0 2.40 5,040.0 2.15 2.780.0 (4,009.0) 388.0 252.0 178.0 388.0 0 0 3.0 8,748.0 818.0 104.0 0 62.0 141.0 0 0 10,299 2.424.0 3.08 6.8010 2.81 2.000.0 (5.108.0) 4320 227.0 192.0 377.0 0 0 0 40 8.1020 818.0 520 0 319,0 180 0 11,528 2,424.0 3.85 8,670,0 3.58 1,988.0 (5.434.0) 640.0 613.0 238.0 724.0 0 0 2.0 9.228.0 618.0 45.0 0 688.0 19.0 0 13,277 2.448.0 4.99 11,537.0 4.71 2,643.0 (8.254.0) 912.0 249.0 265.0 465.0 0 0 0 2.0 11.906.0 818.0 49.0 0 0 680.0 29.0 0 0 13.775 2.480.0 8.81 0.0830 402 7.718.0 (3.843.0) 1,100.0 632.0 457.0 737.0 0 0 4.0 12,130.0 4.193.0 2.7370 440.0 2.386.0 241.0 0 18,975 24,404.0 4,349.0 2,339.0 CF 5,063.0 CF 0 Company Notes NA NA NA 2020 Notes 2021 Notes NA Effective Date Nov-22-2017 Mar-07-2018 Feb-27-2019 Feb-25-2020 Mar-03-2021 Feb-17-2022Step by Step Solution
There are 3 Steps involved in it
Step: 1

Get Instant Access to Expert-Tailored Solutions
See step-by-step solutions with expert insights and AI powered tools for academic success
Step: 2

Step: 3

Ace Your Homework with AI
Get the answers you need in no time with our AI-driven, step-by-step assistance
Get Started


