

Answered step by step
Verified Expert Solution
Question
1 Approved Answer
calculate all these ratios of 2016 of the following data fx 2 A B 1 2 3 Gross Profit margin Net profit margin Return on
calculate all these ratios of 2016
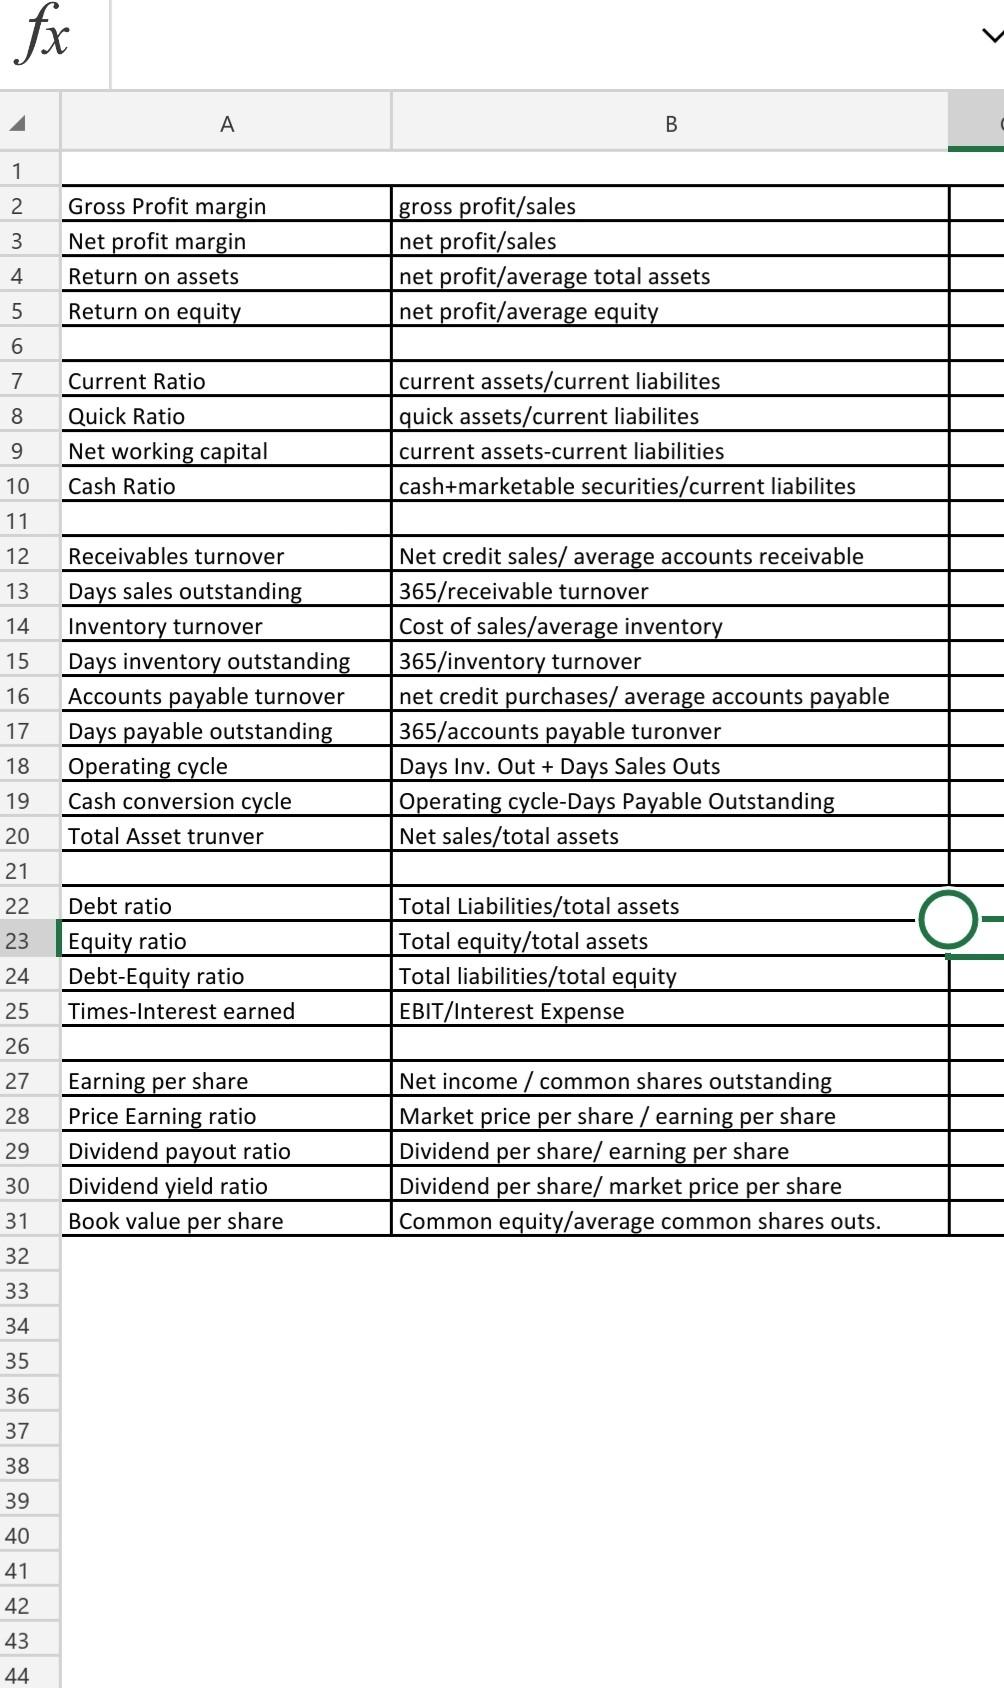
of the following data
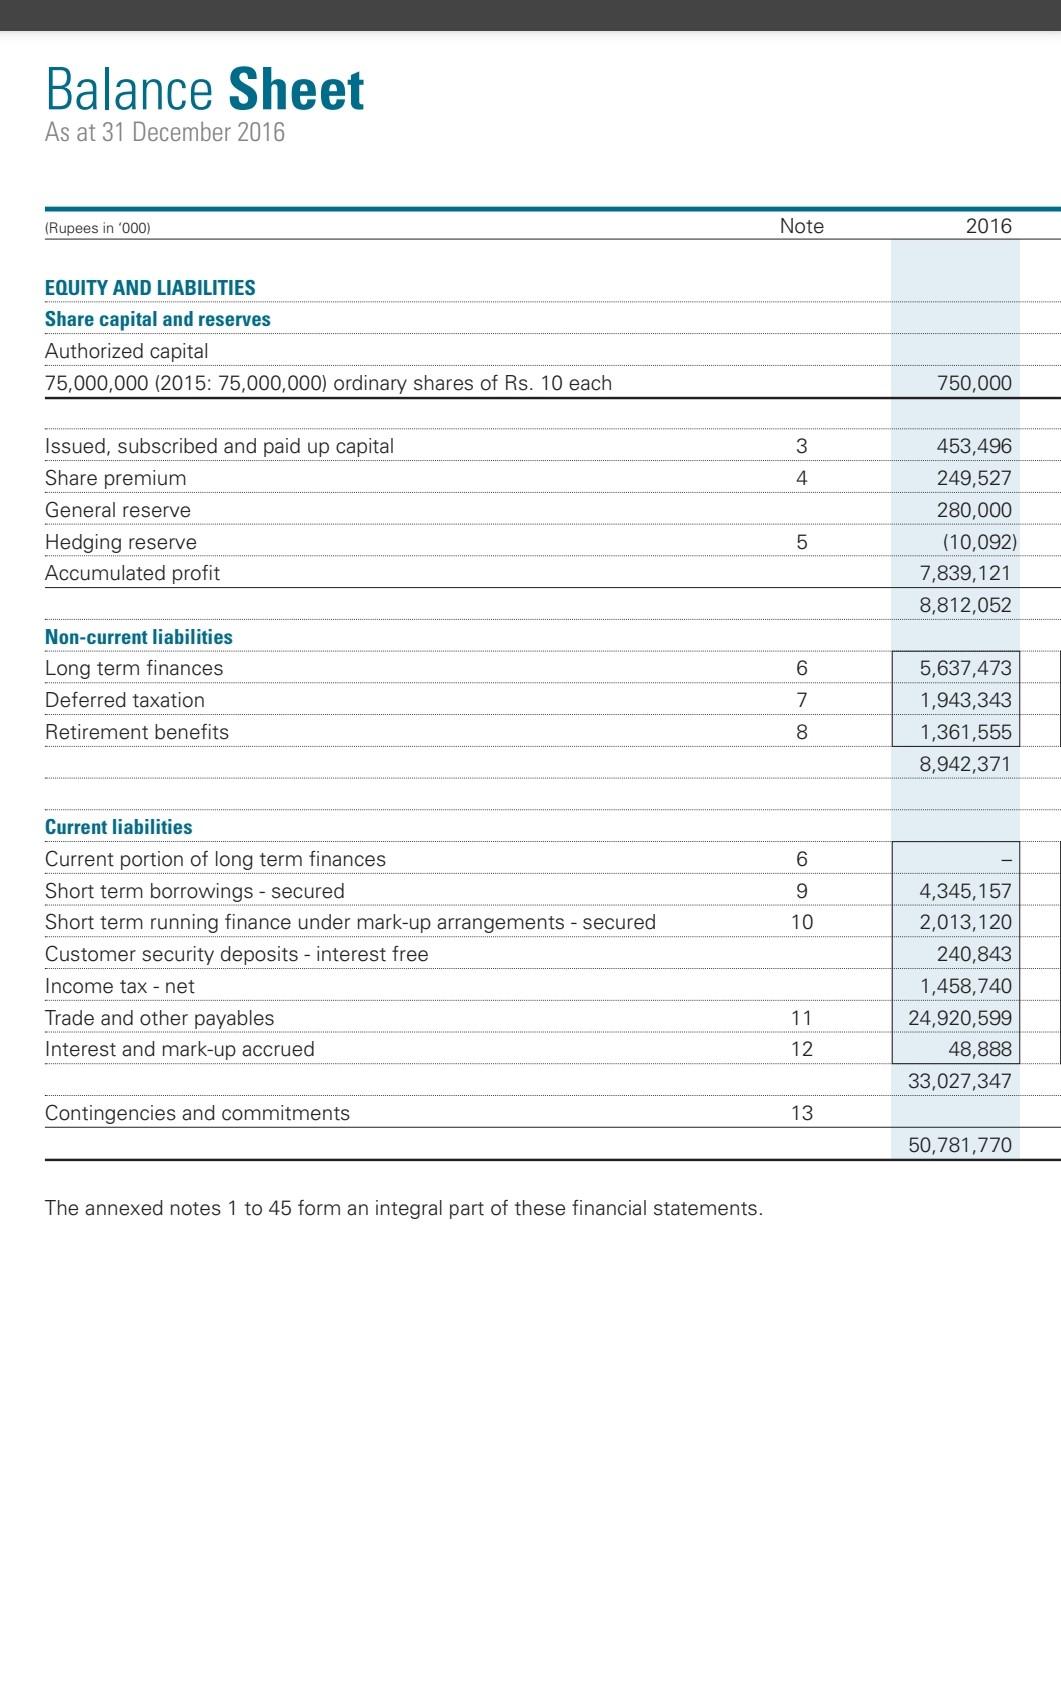
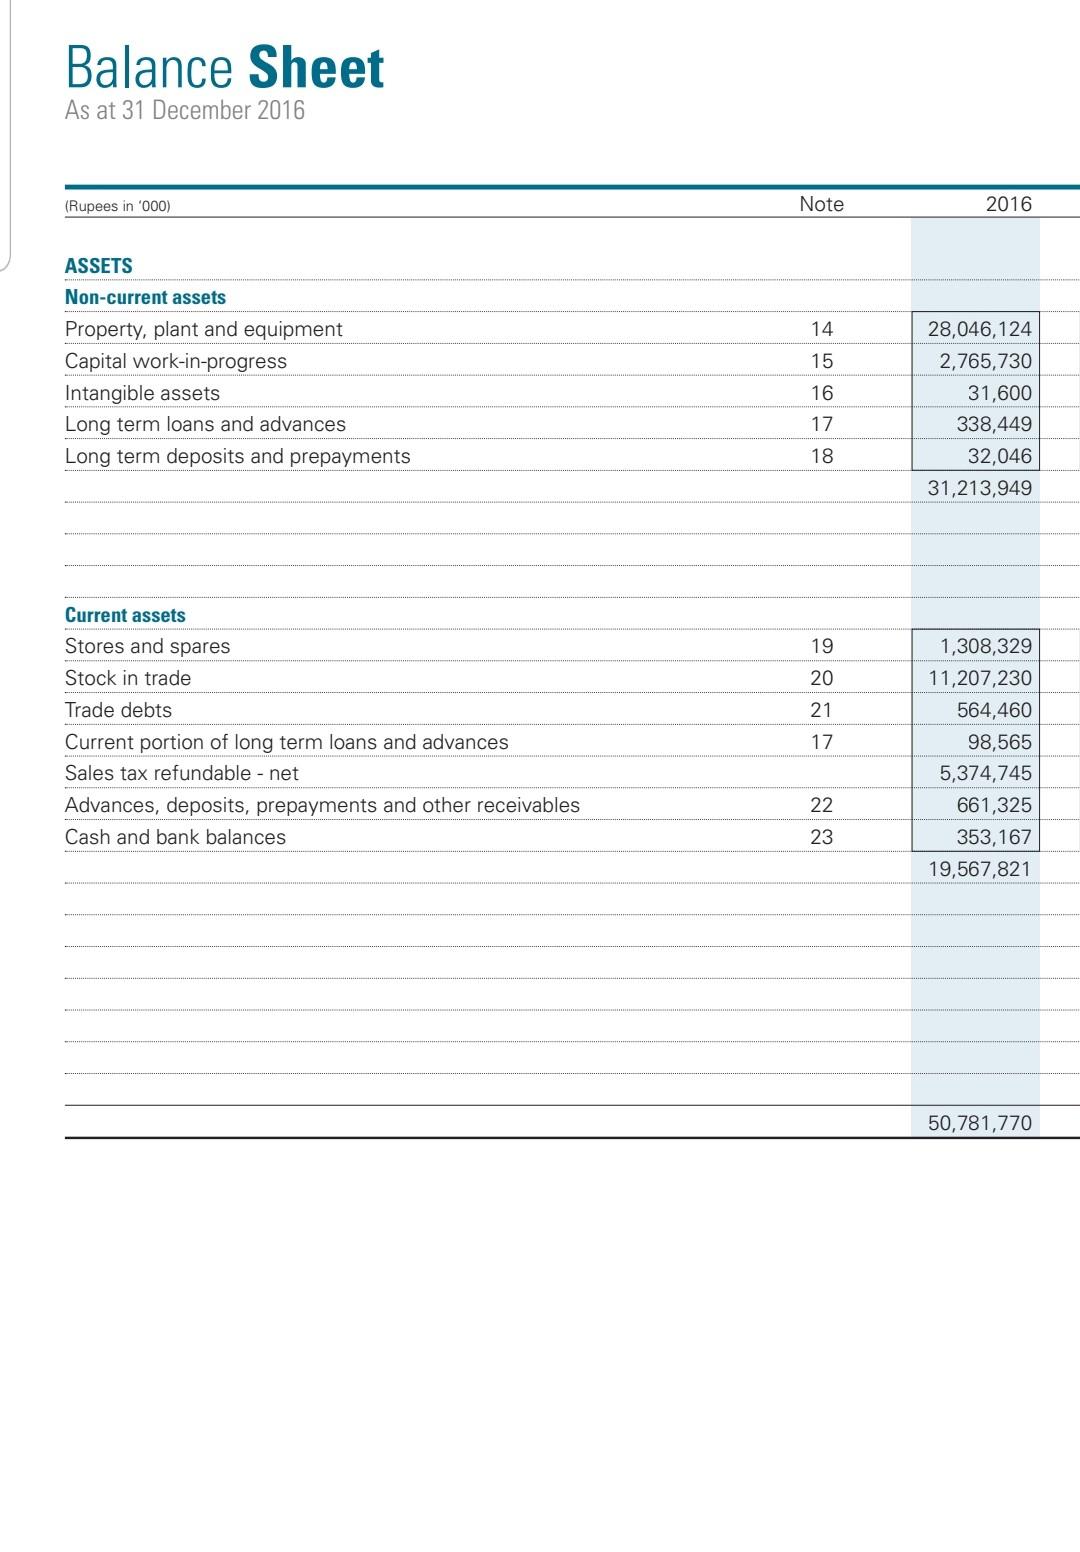
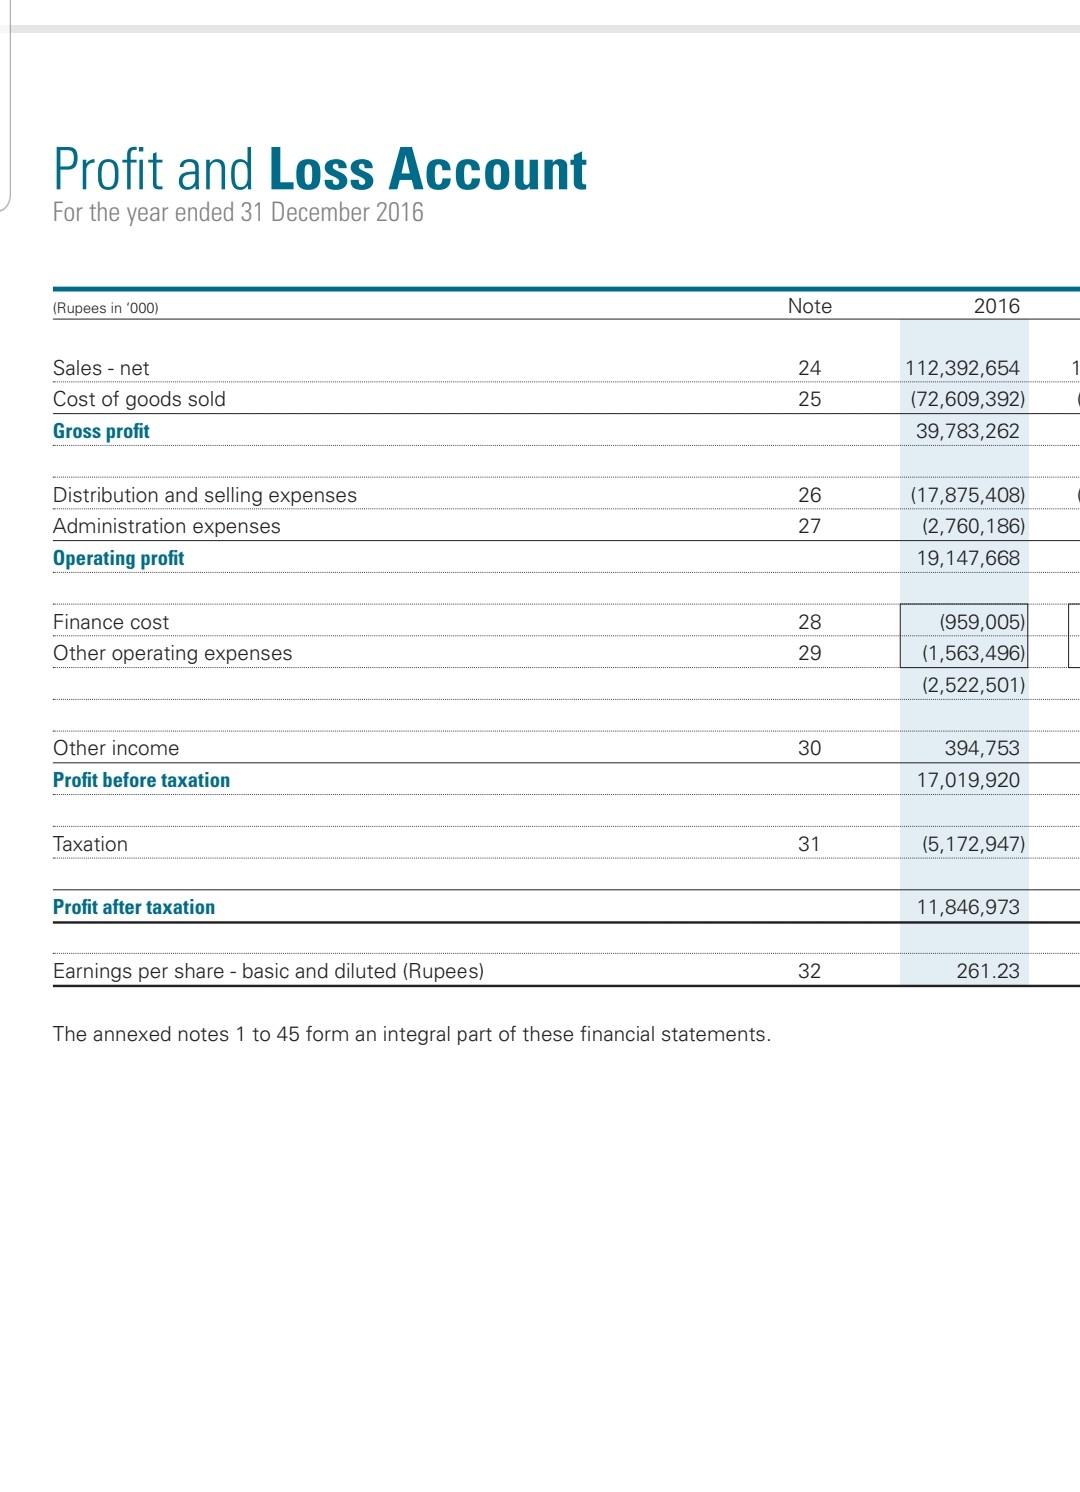
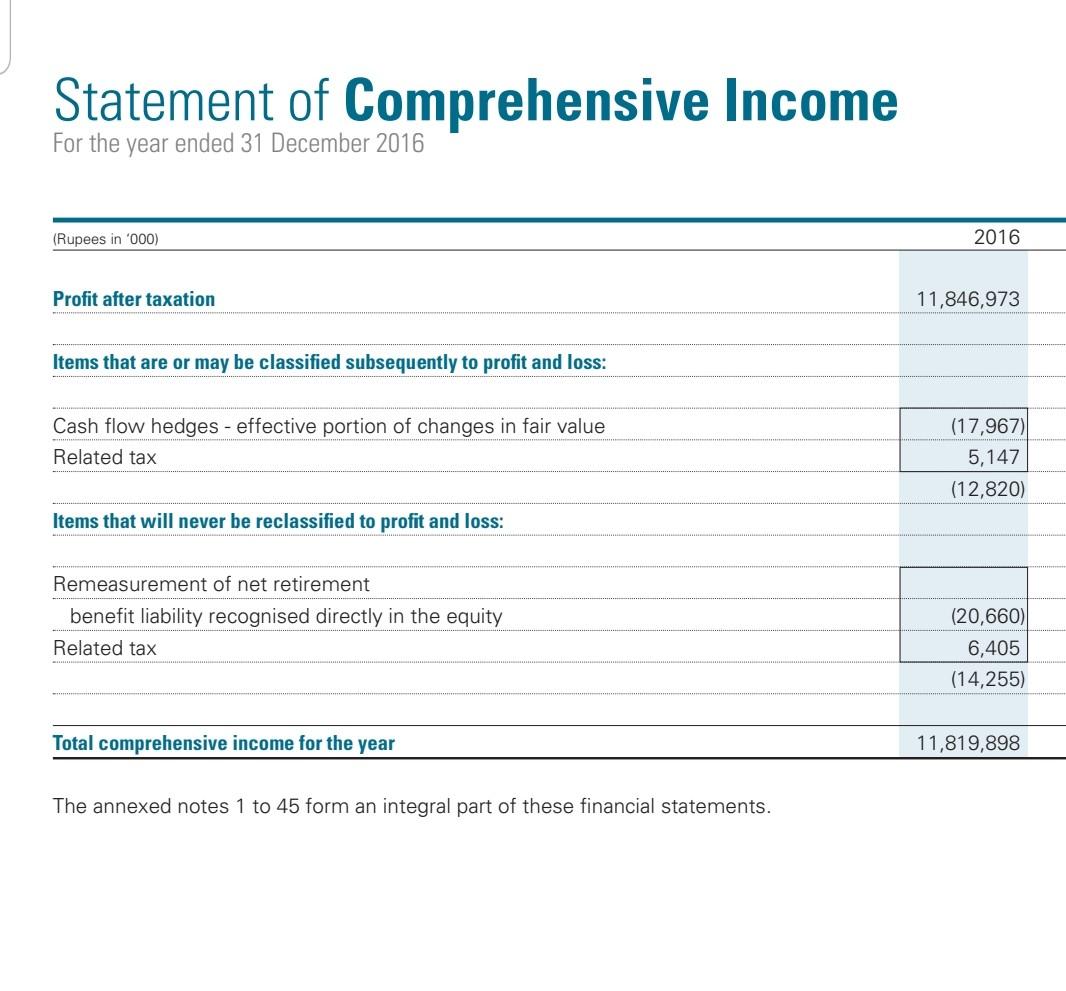
fx 2 A B 1 2 3 Gross Profit margin Net profit margin Return on assets Return on equity gross profit/sales net profit/sales net profit/average total assets net profit/average equity 4 5 6 7 8 Current Ratio Quick Ratio Net working capital Cash Ratio current assets/current liabilites quick assets/current liabilites current assets-current liabilities cash+marketable securities/current liabilites 9 10 11 12 13 14 15 16 Receivables turnover Days sales outstanding Inventory turnover Days inventory outstanding Accounts payable turnover Days payable outstanding Operating cycle Cash conversion cycle Total Asset trunver Net credit sales/ average accounts receivable 365/receivable turnover Cost of sales/average inventory 365/inventory turnover net credit purchases/ average accounts payable 365/accounts payable turonver Days Inv. Out + Days Sales Outs Operating cycle-Days Payable Outstanding Net sales/total assets 17 18 19 20 21 22 23 Debt ratio Equity ratio Debt-Equity ratio Times-Interest earned Total Liabilities/total assets Total equity/total assets Total liabilities/total equity EBIT/Interest Expense 24 25 26 27 28 29 Earning per share Price Earning ratio Dividend payout ratio Dividend yield ratio Book value per share Net income / common shares outstanding Market price per share / earning per share Dividend per share/ earning per share Dividend per share/ market price per share Common equity/average common shares outs. 30 31 32 33 34 35 36 37 38 39 40 41 42 43 44 Balance Sheet As at 31 December 2016 (Rupees in '000) Note 2016 EQUITY AND LIABILITIES Share capital and reserves Authorized capital 75,000,000 (2015: 75,000,000) ordinary shares of Rs. 10 each 750,000 3 4 Issued, subscribed and paid up capital Share premium General reserve Hedging reserve Accumulated profit 453,496 249,527 280,000 (10,092) 7,839,121 8,812,052 5 6 Non-current liabilities Long term finances Deferred taxation Retirement benefits 7 5,637,473 1,943,343 1,361,555 8,942,371 8 6 9 10 Current liabilities Current portion of long term finances Short term borrowings - secured Short term running finance under mark-up arrangements - secured Customer security deposits - interest free Income tax - net Trade and other payables Interest and mark-up accrued 4,345,157 2,013,120 240,843 1,458,740 24,920,599 48,888 33,027,347 11 12 Contingencies and commitments 13 50,781,770 The annexed notes 1 to 45 form an integral part of these financial statements. Balance Sheet As at 31 December 2016 (Rupees in '000) Note 2016 14 ASSETS Non-current assets Property, plant and equipment Capital work-in-progress Intangible assets Long term loans and advances Long term deposits and prepayments 15 16 28,046,124 2,765,730 31,600 338,449 32,046 31,213,949 17 18 19 20 21 Current assets Stores and spares Stock in trade Trade debts Current portion of long term loans and advances Sales tax refundable - net Advances, deposits, prepayments and other receivables Cash and bank balances 17 1,308,329 11,207,230 564,460 98,565 5,374,745 661,325 353,167 19,567,821 22 23 50,781,770 Profit and Loss Account For the year ended 31 December 2016 (Rupees in '000) Note 2016 24 1 Sales - net Cost of goods sold Gross profit 25 112,392,654 (72,609,392) 39,783,262 26 Distribution and selling expenses Administration expenses Operating profit 27 (17,875,408) (2,760,186) 19,147,668 28 Finance cost Other operating expenses 29 (959,005) (1,563,496) (2,522,501) Other income 30 394,753 17,019,920 Profit before taxation Taxation 31 (5,172,947) Profit after taxation 11,846,973 Earnings per share - basic and diluted (Rupees) 32 261.23 The annexed notes 1 to 45 form an integral part of these financial statements. Statement of Comprehensive Income For the year ended 31 December 2016 (Rupees in '000) 2016 Profit after taxation 11,846,973 Items that are or may be classified subsequently to profit and loss: Cash flow hedges - effective portion of changes in fair value Related tax (17,967) 5,147 (12,820) Items that will never be reclassified to profit and loss: Remeasurement of net retirement benefit liability recognised directly in the equity Related tax (20,660) 6,405 (14,255) Total comprehensive income for the year 11,819,898 The annexed notes 1 to 45 form an integral part of these financial statements
Step by Step Solution
There are 3 Steps involved in it
Step: 1

Get Instant Access to Expert-Tailored Solutions
See step-by-step solutions with expert insights and AI powered tools for academic success
Step: 2

Step: 3
Ace Your Homework with AI
Get the answers you need in no time with our AI-driven, step-by-step assistance
Get Started
Financial Markets and Institutions
Authors: Jeff Madura
12th edition
9781337515535, 1337099740, 1337515531, 978-1337099745