Question
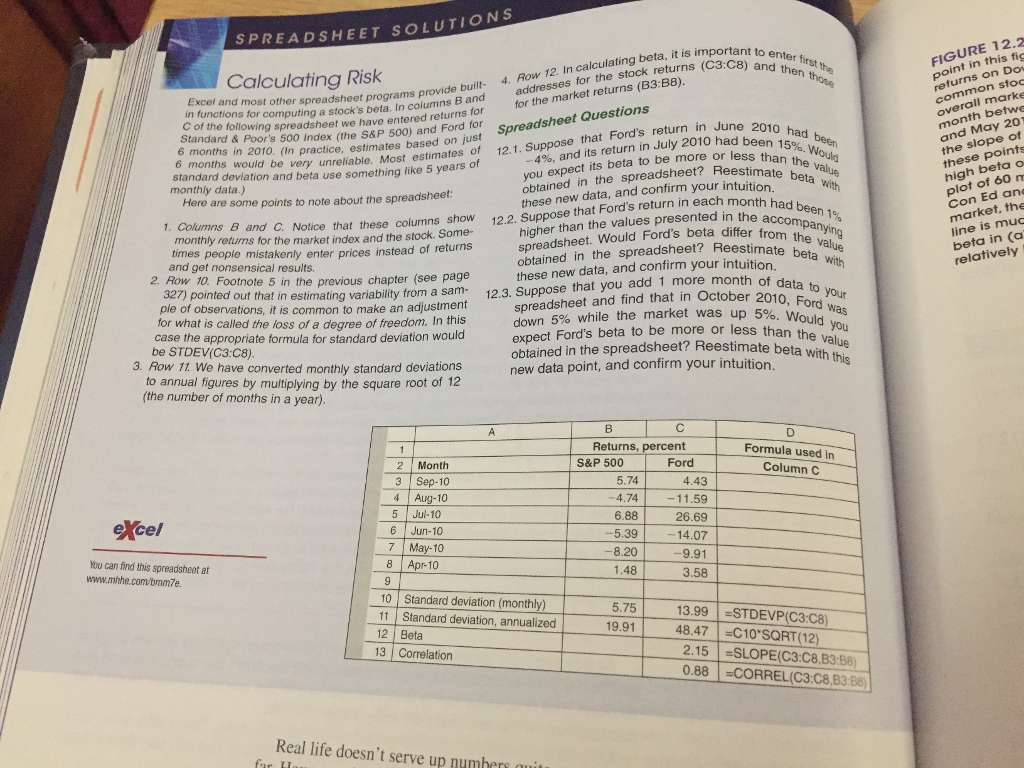
Calculate Apple's beta. Use this page--348-- and complete for Apple's stock. Use 6 months August 2017 - January 2018. Use Yahoo Finance as the data

Calculate Apple's beta. Use this page--348-- and complete for Apple's stock. Use 6 months August 2017 - January 2018. Use Yahoo Finance as the data source. Please use the spreadsheet in the text. Calculate monthly returns--starting vs ending. Compare using the market (S&P) as shown in the text, but for Apple.
Apple:
Aug: closing price start of month = 150.0 clsoing price at the end of the month = 164
Sept: closing price start of month = 164.05 closing price at the end of the month = 154.12
Oct: closing price start of month = 153.81 closing price at end of the month = 169.04
Nov closing price start of month = 166.89 closing price at end of the month = 171.85
Dec closing price start of month = 171.05 closing price at end of the month = 169.23
Jan closing price start of month = 172.26 closing price at end of the month = 167.43
S&P 500
Aug: closing price start of month = 2476.35 closing price at end of the month = 2471.65
Sept: closing price start of month = 2476.55 closing price at end of the month = 2519.36
Oct: closing price start of month = 2529.12 closing price at end of the month = 2575.26
Nov: closing price start of month = 2579.36 closing price at end of the month = 2647.58
Dec: closing price start of month = 2642.22 closing price at end of the month = 2673.61
Jan: closing price start of month = 2695.81 closing price at end of the month = 2823.81
SPREADSHEET SOLUTIONS FIGURE 12.2 point in this fig Calculating Risk returns (C3:C8) and first 4. Row 12. In calculating beta, it is im Excel and most other spreadsheet programs pro addresses for the stock programs provide built- for computing a stock's beta. In columns B and for for the market returns (B3:B8) C of the following spreadsheet we have entered returns Standard & Poor's 500 Index (the S&P 500) and Ford for 6 months in 2010. (In practice, estimates based on jus 6 months would be very unreliable. Most estimates of 12.1 standard deviation and beta use something like 5 years of month betwe and May 20 the slope of -496, and its return in July 2010 had been had you expect its beta to be more or less thais%. obtained in the spreadsheet? Rees these new data, and confirm your intuition . Suppose that Ford's return in June 2010 Here are some points to note about the spreadshee: . Columns B and C. Notice that these columns show 122. Suppose that Ford's return in each month k Con Ed an monthly returns for the market index and the stock. Some- higher than the values presented in the a times people mistakenly enter prices instead of returns 2. Row 10. Footnote 5 in the previous chapter (see page ple of observations, it is common to make an adjustment readsheet. Would Ford's beta differ f obtained in the spreadsheet? Ree these new data, and confirm your intuitioneta and get nonsensical results. relatively out that in estimating variability from a sam 12.3. Suppose that you add 1 more month of da spreadsheet and find that in October 2010. down 5% while the market was up 5%. Would was expect Ford's beta to be more or less tha obtained in the spreadsheet? Reestimate b new data point, and confirm your intuition. for what is called the loss of a degree of freedom. In this case the appropriate formula for standard deviation wou be STDEV(C3:C8) 3. Row 11 We have converted monthly standard deviations to annual figures by multiplying by the square root of 12 beta (the number of months in a year). Returns, percentFo Formula used in excel You can find this spreadsheet at 10 Standard deviation (monthly) 1 Standard deviation, annualized 13.99STDEVP(C3:C8) 48.47 |=C10"SQRT(12) 2.15SLOPE(C3:C8,B3:88 0.88CORREL(C3:C8,B3.B8) 13 tion Real life doesn't serve up numherStep by Step Solution
There are 3 Steps involved in it
Step: 1

Get Instant Access to Expert-Tailored Solutions
See step-by-step solutions with expert insights and AI powered tools for academic success
Step: 2

Step: 3

Ace Your Homework with AI
Get the answers you need in no time with our AI-driven, step-by-step assistance
Get Started


