Answered step by step
Verified Expert Solution
Question
1 Approved Answer
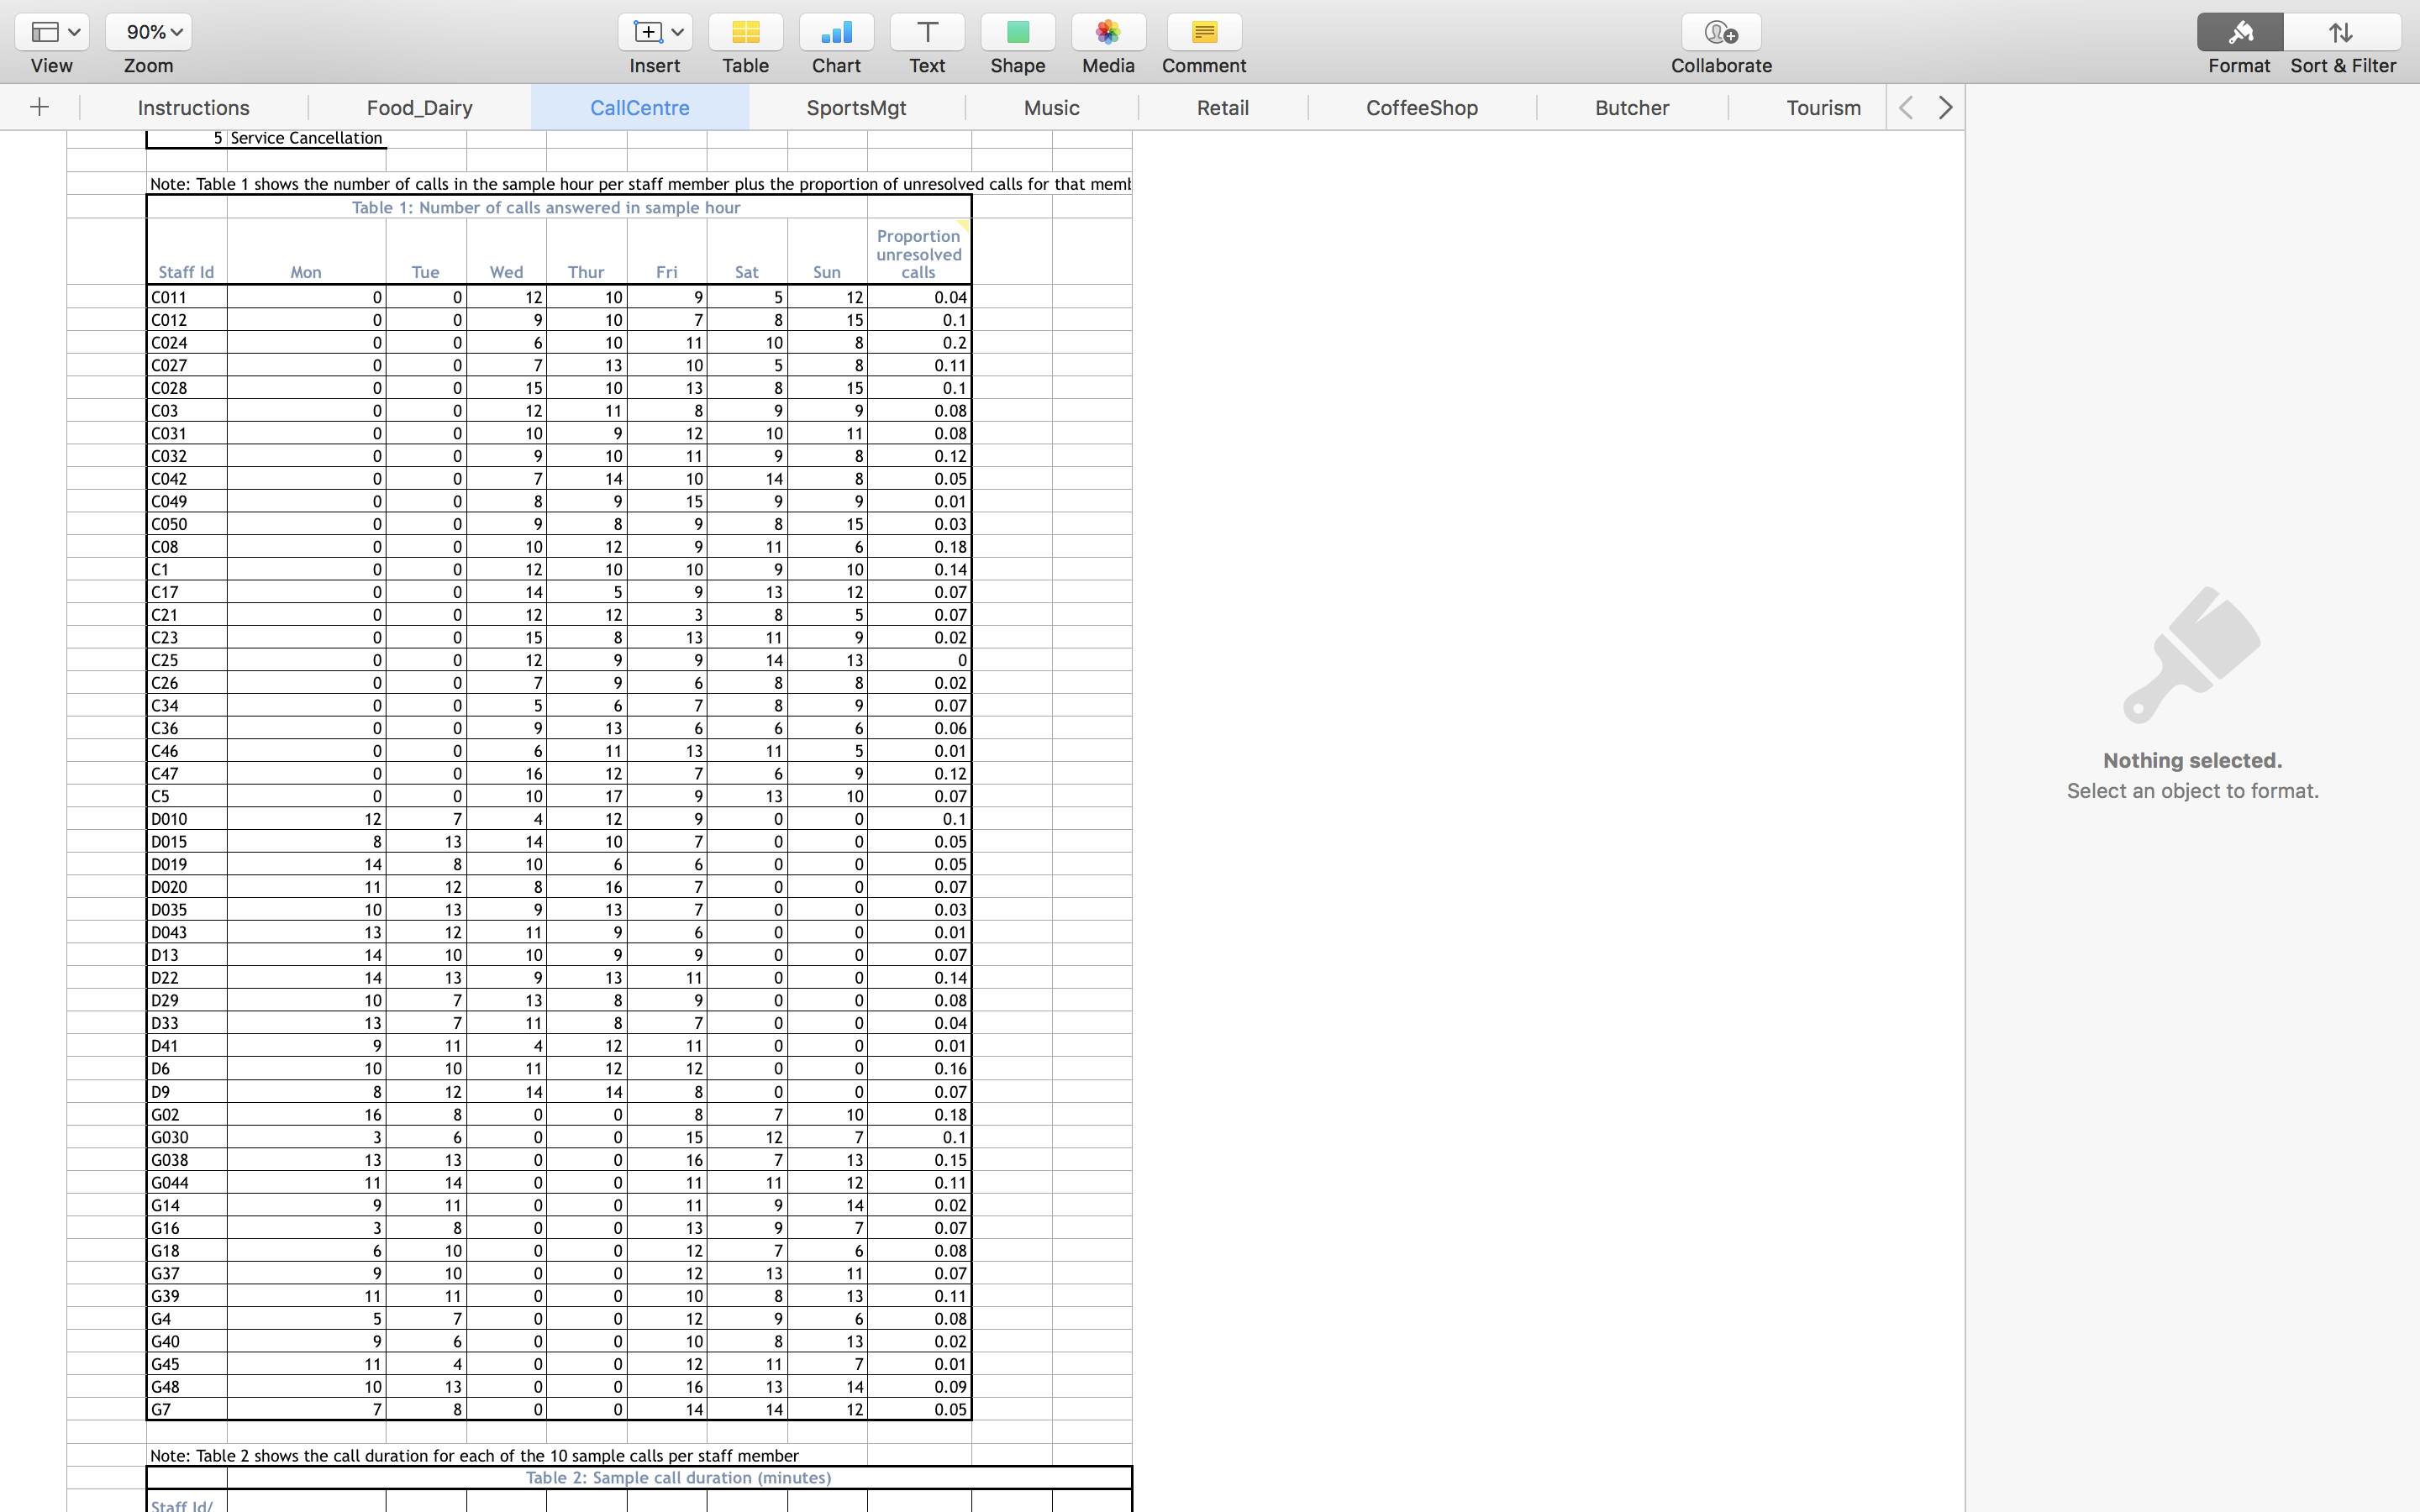
Calculate at least 2 measures of central tendency and at least 2 measures of variation for your Continuous Variable sample data. Explain the results and
- Calculate at least 2 measures of central tendency and at least 2 measures of variation for
- your Continuous Variable sample data. Explain the results and meaning of these measures in your report. Include a summary of the data in your report using a graph or table. Use Excel for this task.
- Describe what is a Discrete Probability Distribution. Identify/develop a Discrete Random Variable in your dataset. Use an appropriate Discrete Probability Distribution you have learnt in class to illustrate how you could apply these technique to solve your business problems.
- Inferential Statistics
- a.You may want to include some theoretical background to the Normal (and Sampling)
- Distribution. Topics could include:
- What is the Normal Distribution?
- Why is the Normal Distribution used in Sampling Distributions?
- What is the basis for Inferential Statistics?
- b.You should include:
- An explanation of your continuous random variable and sampling work
- An explanation of what a Confidence Interval / Hypothesis Test is;
- An interpretation of your Confidence Interval/ Hypothesis Test results;
- c. Either do 3c.i OR 3c.ii
- i. Calculate and interpret a confidence interval estimate of an appropriate
- Continuous Random Variable from your dataset. Choose 95% confidence level
- for your interval. (OR)
- ii. Set up and conduct a hypothesis test relevant to the continuous random variable.
- Choose 5% significance level for your test. Identify what is your Type I and II
- errors.
- By using the Data Analysis function in Excel, show how Regression techniques can be
- used to extrapolate or interpolate values for your dependent variable. Include the Regression Analysis Excel output and state your predictive model. Test one of the four assumptions.

Step by Step Solution
There are 3 Steps involved in it
Step: 1

Get Instant Access to Expert-Tailored Solutions
See step-by-step solutions with expert insights and AI powered tools for academic success
Step: 2

Step: 3

Ace Your Homework with AI
Get the answers you need in no time with our AI-driven, step-by-step assistance
Get Started


