CALCULATE
B. Operating Profitability 1. Operating Return on Assets 2. Operating Profit Margin 3. Total Asset Turnover C. Financing Decisions 1. Debt Ratio


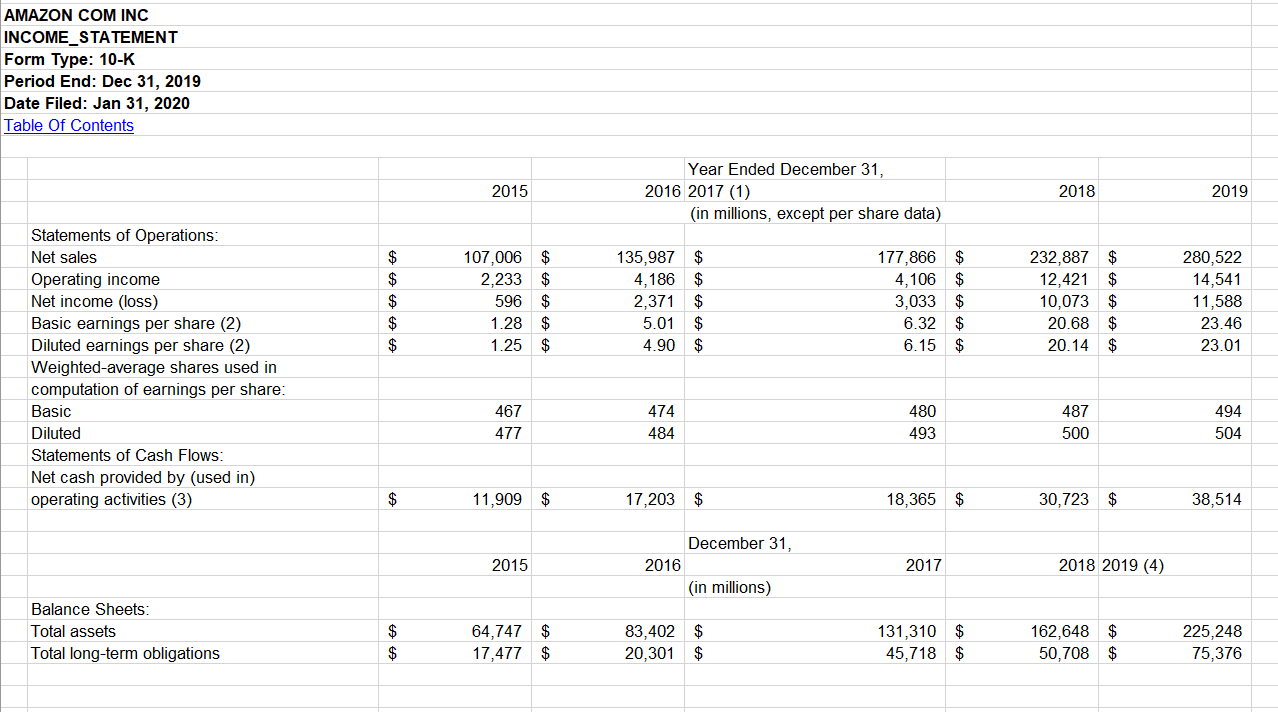
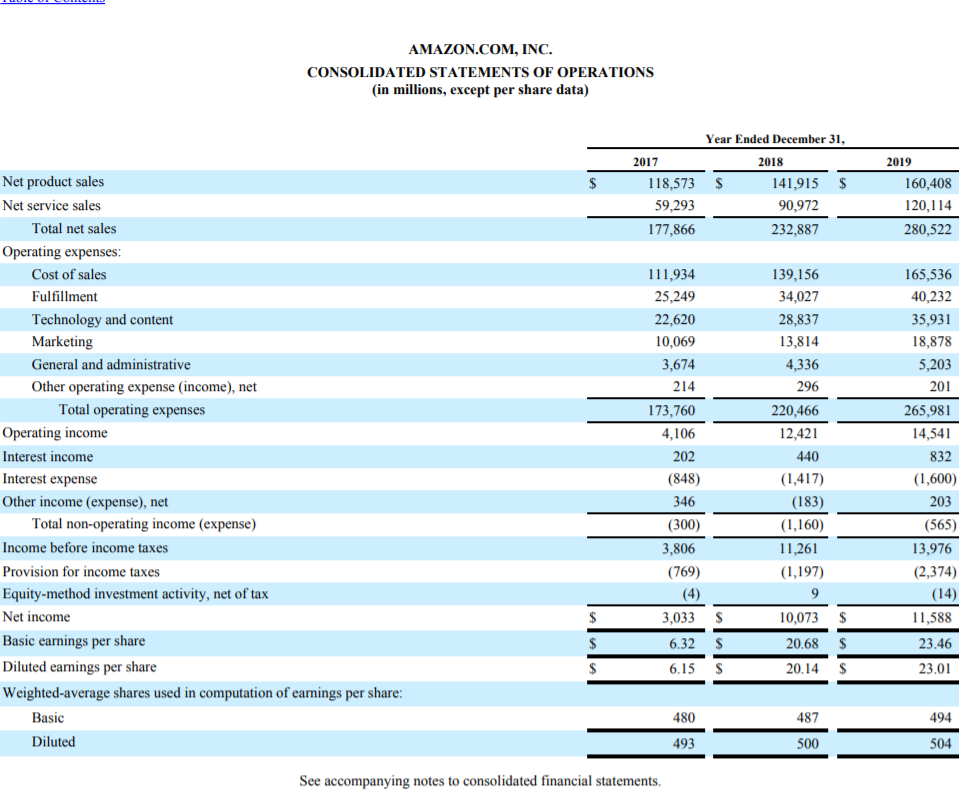
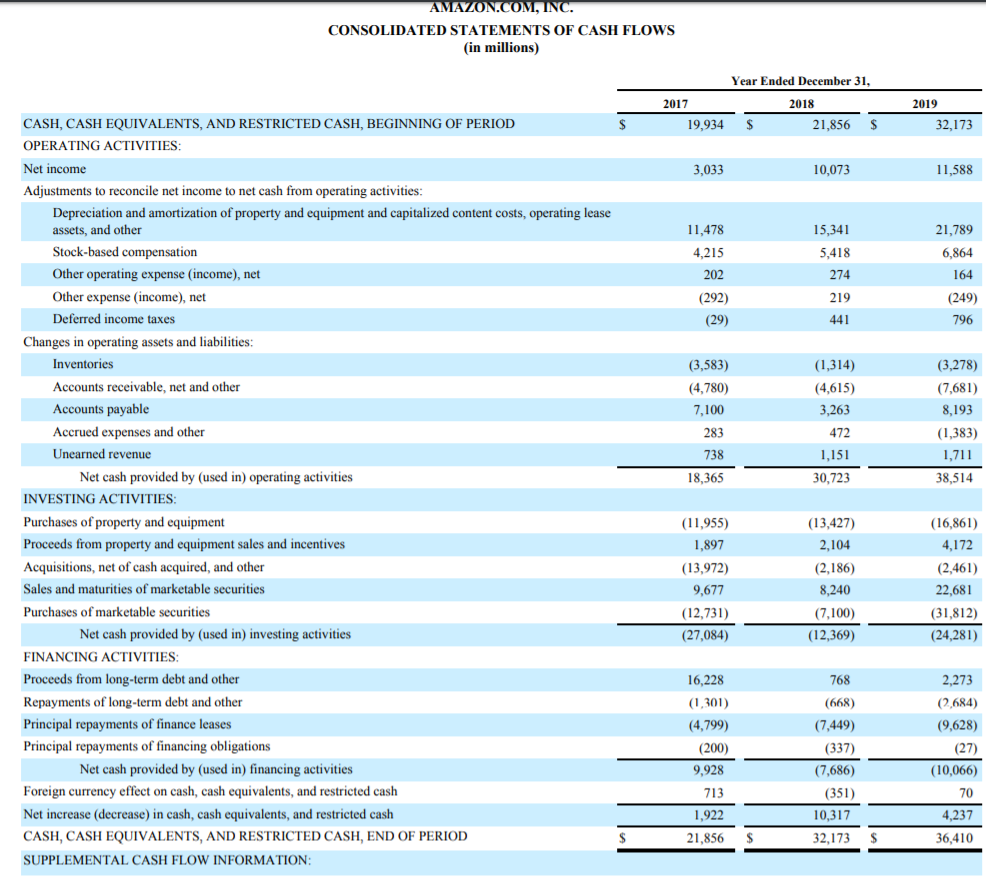
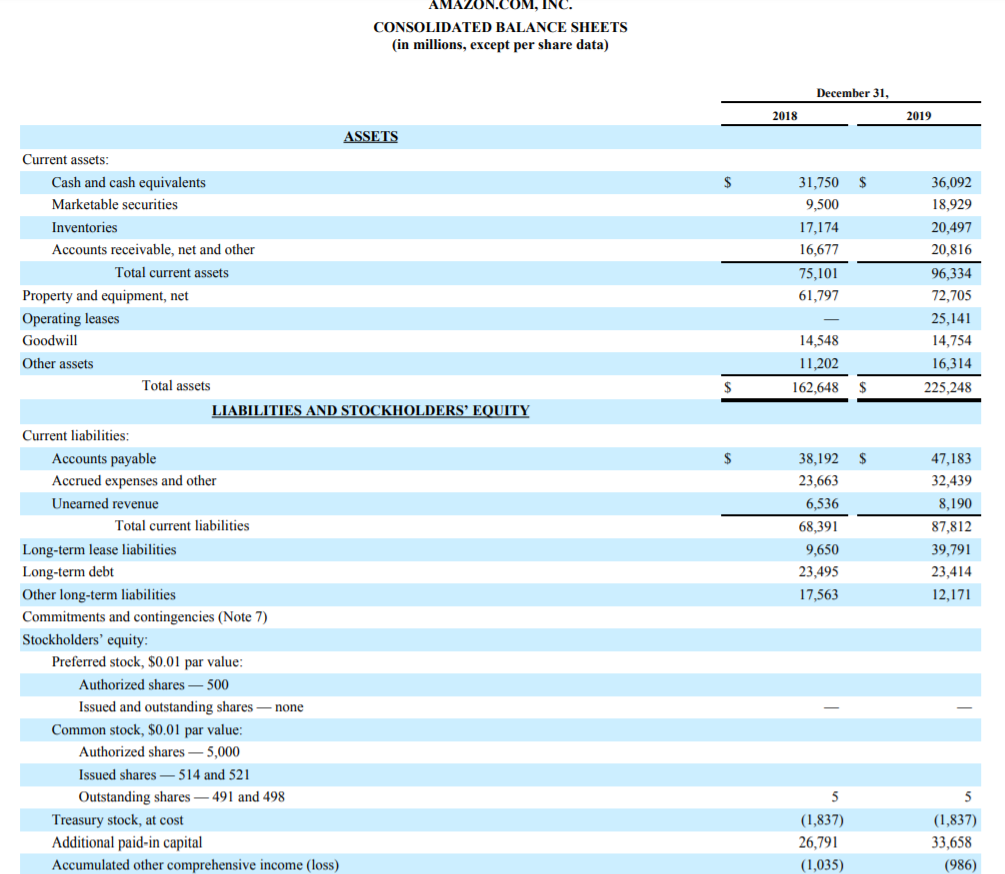
AMAZON COM INC INCOME_STATEMENT Form Type: 10-K Period End: Dec 31, 2019 Date Filed: Jan 31, 2020 Table of Contents 2015 Year Ended December 31, 2016 2017 (1) (in millions, except per share data) 2018 2019 $ $ $ $ 107,006 2.233 596 1.28 1.25 $ $ $ 135,987 $ 4,186 $ 2,371 $ 5.01 $ 4.90 $ 177,866 $ 4,106 $ 3,033 6.32 $ 6.15 $ $ 232,887 $ 12,421 $ 10,073 $ 20.68 $ 20.14 $ 280,522 14,541 11,588 23.46 23.01 $ Statements of Operations: Net sales Operating income Net income (loss) Basic earnings per share (2) Diluted earnings per share (2) Weighted average shares used in computation of earnings per share: Basic Diluted Statements of Cash Flows: Net cash provided by (used in) operating activities (3) 487 494 467 477 474 484 480 493 500 504 $ 11,909 $ 17,203 $ 18,365 $ 30,723 $ 38,514 December 31, 2015 2016 2017 2018 2019 (4) (in millions) Balance Sheets: Total assets Total long-term obligations $ $ $ 64,747 $ 17,477 $ 83,402 20,301 $ $ 131,310 $ 45,718 $ 162.648 50,708 225,248 75,376 $ AMAZON.COM, INC. CONSOLIDATED STATEMENTS OF OPERATIONS (in millions, except per share data) 2019 Year Ended December 31, 2017 2018 118,573 $ 141,915 $ 59,293 90,972 177,866 232,887 160,408 120,114 280,522 111,934 25,249 22,620 10,069 3,674 214 173,760 4,106 Net product sales Net service sales Total net sales Operating expenses: Cost of sales Fulfillment Technology and content Marketing General and administrative Other operating expense (income), net Total operating expenses Operating income Interest income Interest expense Other income (expense), net Total non-operating income (expense) Income before income taxes Provision for income taxes Equity-method investment activity, net of tax Net income Basic earnings per share Diluted earnings per share Weighted-average shares used in computation of earnings per share: Basic Diluted 202 139,156 34,027 28,837 13,814 4,336 296 220,466 12,421 440 (1,417) (183) (1,160) 11,261 (1,197) 9 10,073 $ 20.68 $ 20.14 $ 165,536 40,232 35,931 18,878 5,203 201 265,981 14,541 832 (1,600) 203 (565) 13,976 (2,374) (14) 11,588 23.46 (848) 346 (300) 3,806 (769) (4) 3,033 $ 6.32 $ 6.15 S $ $ $ 23.01 494 480 493 487 500 504 See accompanying notes to consolidated financial statements. AMAZON.COM, INC. CONSOLIDATED STATEMENTS OF CASH FLOWS (in millions) Year Ended December 31, 2017 2019 2018 21,856 $ 19,934 $ $ 32.173 3,033 10,073 11,588 11.478 15.341 4.215 21,789 6,864 164 5,418 274 219 202 (292) (29) (249) 796 441 (3,583) (4,780) 7,100 283 (1,314) (4,615) 3,263 (3,278) (7,681) 8,193 (1,383) 1,711 38,514 472 1.151 738 18,365 30,723 CASH, CASH EQUIVALENTS, AND RESTRICTED CASH, BEGINNING OF PERIOD OPERATING ACTIVITIES: Net income Adjustments to reconcile net income to net cash from operating activities: Depreciation and amortization of property and equipment and capitalized content costs, operating lease assets, and other Stock-based compensation Other operating expense (income), net Other expense income), net Deferred income taxes Changes in operating assets and liabilities: Inventories Accounts receivable, net and other Accounts payable Accrued expenses and other Unearned revenue Net cash provided by (used in) operating activities INVESTING ACTIVITIES Purchases of property and equipment Proceeds from property and equipment sales and incentives Acquisitions, net of cash acquired, and other Sales and maturities of marketable securities Purchases of marketable securities Net cash provided by (used in) investing activities FINANCING ACTIVITIES: Proceeds from long-term debt and other Repayments of long-term debt and other Principal repayments of finance leases Principal repayments of financing obligations Net cash provided by (used in) financing activities Foreign currency effect on cash, cash equivalents, and restricted cash Net increase (decrease) in cash, cash equivalents, and restricted cash CASH, CASH EQUIVALENTS, AND RESTRICTED CASH, END OF PERIOD SUPPLEMENTAL CASH FLOW INFORMATION: (16,861) 4,172 (11,955) 1,897 (13,972) 9,677 (12,731) (13,427) 2,104 (2,186) 8,240 (7,100) (12,369) (2,461) 22,681 (31,812) (24,281) (27,084) 16,228 768 (1,301) (4,799) (200) 9,928 713 (668) (7,449) (337) (7,686) (351) 10,317 32,173 2,273 (2,684) (9,628) (27) (10,066) 70 1,922 21,856 4,237 36,410 $ 328 854 $ 875 3,361 647 200 381 119 39 Cash paid for interest on long-term debt Cash paid for operating leases Cash paid for interest on finance leases Cash paid for interest on financing obligations Cash paid for income taxes, net of refunds Assets acquired under operating leases Property and equipment acquired under finance leases Property and equipment acquired under build-to-suit arrangements 194 1,184 957 881 9,637 3,541 10,615 3,641 7,870 13,723 1,362 See accompanying notes to consolidated financial statements. COM, INC. CONSOLIDATED BALANCE SHEETS (in millions, except per share data) December 31, 2018 2019 $ $ 31,750 9,500 17,174 16,677 75,101 61,797 36,092 18,929 20,497 20,816 96,334 72,705 25,141 14,754 16,314 225,248 14,548 11,202 $ 162,648 S $ ASSETS Current assets: Cash and cash equivalents Marketable securities Inventories Accounts receivable, net and other Total current assets Property and equipment, net Operating leases Goodwill Other assets Total assets LIABILITIES AND STOCKHOLDERS' EQUITY Current liabilities: Accounts payable Accrued expenses and other Unearned revenue Total current liabilities Long-term lease liabilities Long-term debt Other long-term liabilities Commitments and contingencies (Note 7) Stockholders' equity: Preferred stock, $0.01 par value: Authorized shares 500 Issued and outstanding shares none Common stock, $0.01 par value: Authorized shares - 5,000 Issued shares 514 and 521 Outstanding shares - 491 and 498 Treasury stock, at cost Additional paid-in capital Accumulated other comprehensive income (loss) 38,192 23,663 6,536 68,391 9,650 23,495 17,563 47,183 32,439 8,190 87,812 39,791 23,414 12,171 (1,837) 26,791 (1,035) 5 (1,837) 33,658 (986) (1,837) 33,658 Treasury stock, at cost Additional paid-in capital Accumulated other comprehensive income (loss) Retained earnings Total stockholders' equity Total liabilities and stockholders' equity (1,837) 26,791 (1,035) 19,625 43,549 162,648 (986) 31,220 62,060 225,248 $ See accompanying notes to consolidated financial statements


