Answered step by step
Verified Expert Solution
Question
1 Approved Answer
Calculate Collections from customers and payments to suppliers (accounts payable). Calculate trends in these amounts and compare these trends to the related trends in sales
- Calculate Collections from customers and payments to suppliers (accounts payable).
- Calculate trends in these amounts and compare these trends to the related trends in sales and COGS.
- Describe any observation.


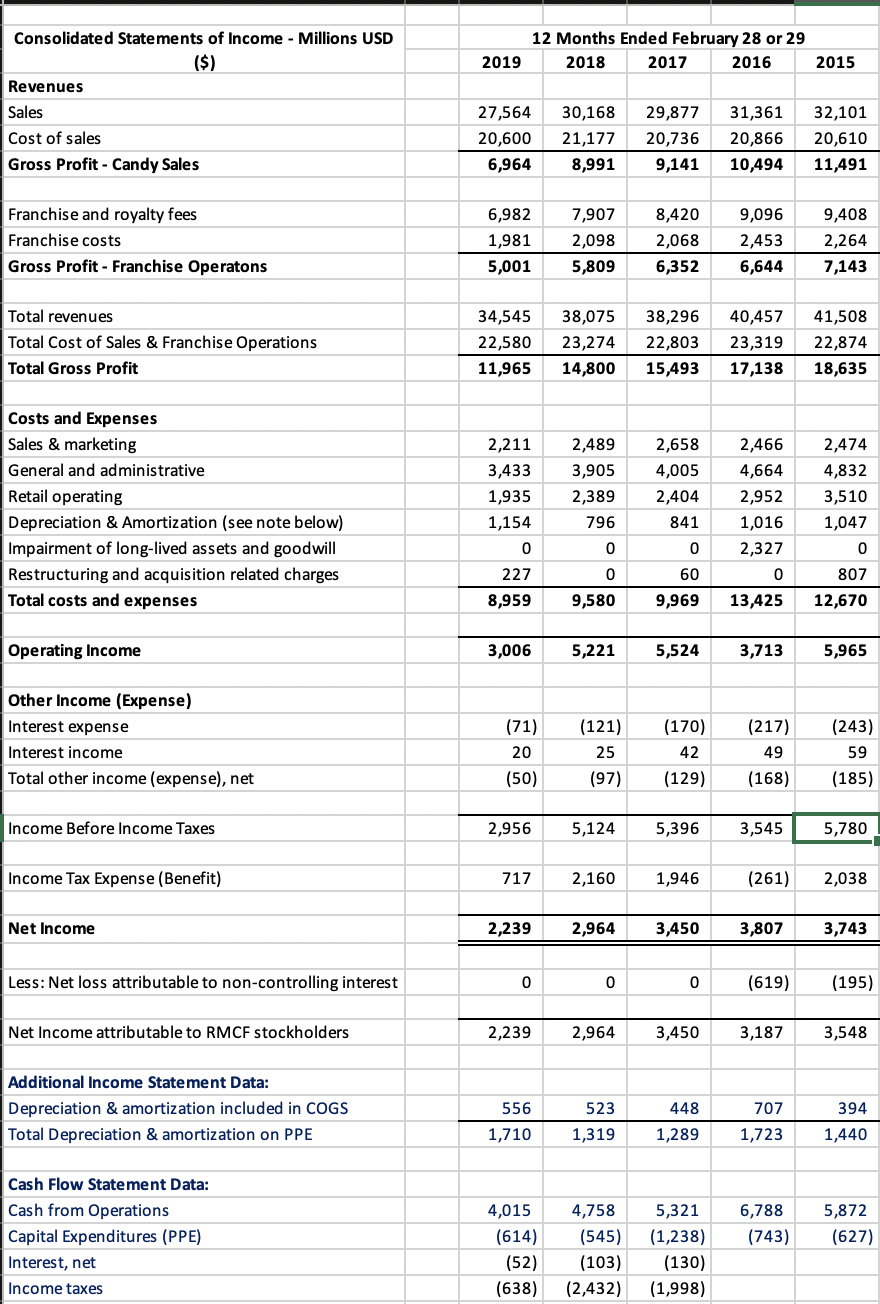
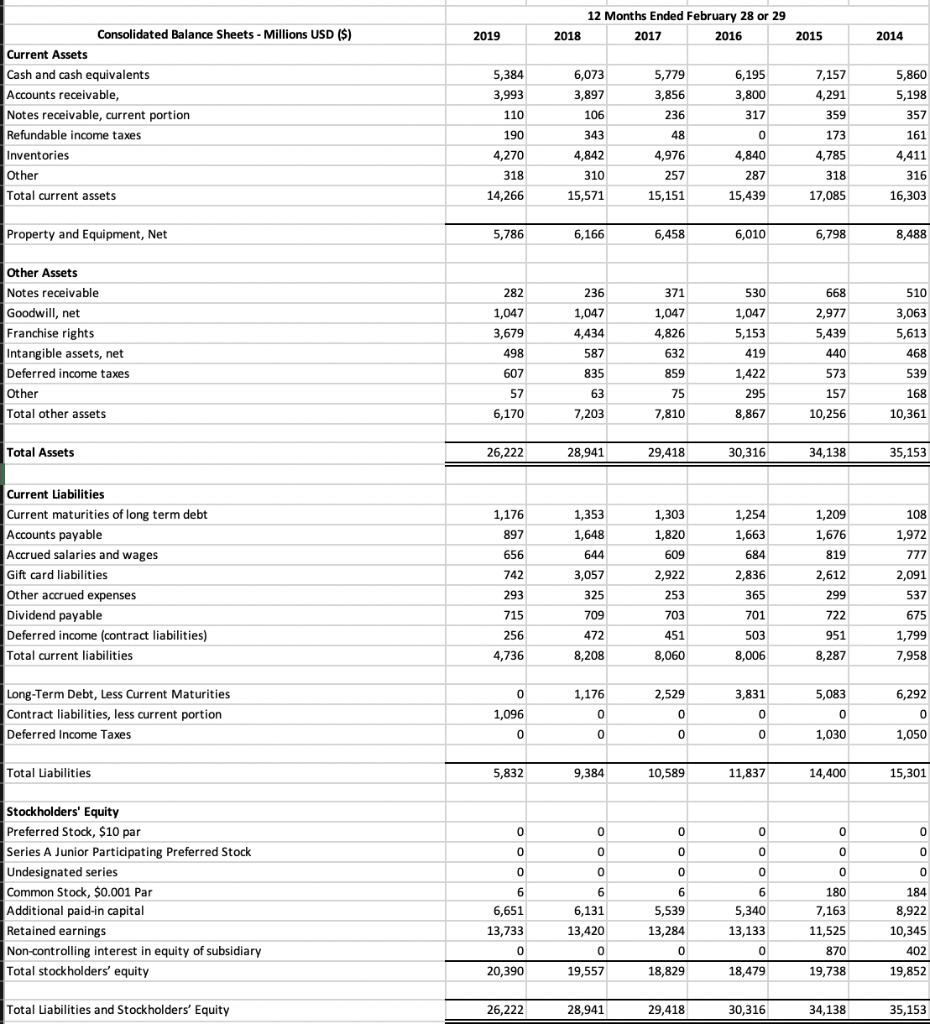
Consolidated Statements of Income - Millions USD ($) Revenues 12 Months Ended February 28 or 29 2018 2017 2016 2019 2015 Sales Cost of sales Gross Profit - Candy Sales 27,564 20,600 6,964 30,168 21,177 8,991 29,877 20,736 9,141 31,361 20,866 10,494 32,101 20,610 11,491 Franchise and royalty fees Franchise costs Gross Profit - Franchise Operatons 6,982 1,981 5,001 7,907 2,098 5,809 8,420 2,068 6,352 9,096 2,453 6,644 9,408 2,264 7,143 Total revenues Total Cost of Sales & Franchise Operations Total Gross Profit 34,545 22,580 11,965 38,075 23,274 14,800 38,296 22,803 15,493 40,457 23,319 17,138 41,508 22,874 18,635 1,935 Costs and Expenses Sales & marketing General and administrative Retail operating Depreciation & Amortization (see note below) Impairment of long-lived assets and goodwill Restructuring and acquisition related charges Total costs and expenses 2,211 2,489 2,658 2,466 2,474 3,433 3,905 4,005 4,664 4,832 2,389 2,404 2,952 3,510 1,1547968411,016 1,047 0 0 0 2,327 0 227 0 60 0807 8,959 9,580 9,969 13,425 12,670 Operating Income 3,006 5,221 5,524 3,713 5,965 Other Income (Expense) Interest expense Interest income Total other income (expense), net (71) - 20 (50) (121) 25 (97) (170) 42 (129) (217) 49 (168) (243) 59 (185) Income Before Income Taxes 2,956 5,124 5,396 3,545 5,780 Income Tax Expense (Benefit) 717 2,160 1,946 (261) 2,038 Net Income 2,239 2,964 3,450 3,807 3,743 Less: Net loss attributable to non-controlling interest O (619) (195) Net Income attributable to RMCF stockholders 2,239 2,964 3,450 3,187 3,548 Additional Income Statement Data: Depreciation & amortization included in COGS Total Depreciation & amortization on PPE 556 1,710 523 1,319 448 1,289 707394 1,723 1,440 Cash Flow Statement Data: Cash from Operations Capital Expenditures (PPE) Interest, net Income taxes 6,788 (743) 5,872 (627) 4,015 (614) (52) (638) 4,758 (545) (103) (2,432) 5,321 (1,238) (130) (1,998) 12 Months Ended February 28 or 29 2017 2016 2019 2018 2015 2014 5,384 3,993 Consolidated Balance Sheets - Millions USD ($) Current Assets Cash and cash equivalents Accounts receivable, Notes receivable, current portion Refundable income taxes Inventories Other Total current assets 110 190 4,270 318 14,266 6,073 3,897 106 343 4,842 310 15,571 5,779 3,856 236 48 4,976 257 15,151 6,195 3,800 317 0 4,840 287 15,439 7,157 4,291 359 173 4,785 318 17,085 5,860 5,198 357 161 4,411 316 16,303 Property and Equipment, Net 5,786 6,166 6,458 6,010 6,798 8,488 282 371 1,047 Other Assets Notes receivable Goodwill, net Franchise rights Intangible assets, net Deferred income taxes Other Total other assets 1,047 3,679 498 236 1,047 4,434 587 835 4,826 632 859 530 1,047 5,153 419 1,422 295 8,867 668 2,977 5,439 440 573 157 10,256 510 3,063 5,613 468 539 168 10,361 607 63 75 57 6,170 7,203 7,810 Total Assets 26,222 28,941 29,418 30,316 34,138 35,153 1,254 Current Liabilities Current maturities of long term debt Accounts payable Accrued salaries and wages Gift card liabilities Other accrued expenses Dividend payable Deferred income (contract liabilities) Total current liabilities 1,176 897 656 742 293 715 256 4,736 1,353 1,648 644 3,057 325 709 472 8,208 1,303 1,820 609 2,922 253 1,663 684 2,836 365 701 503 8,006 1,209 1,676 819 2,612 299 722 951 8,287 108 1,972 777 2,091 537 675 1,799 7,958 703 451 8,060 0 1,176 2,529 3,831 5,083 Long-Term Debt, Less Current Maturities Contract liabilities, less current portion Deferred Income Taxes 1,096 6,292 0 1,050 1,030 Total Liabilities 5,832 9,384 10,589 11,837 14,400 15,301 0 Stockholders' Equity Preferred Stock, $10 par Series A Junior Participating Preferred Stock Undesignated series Common Stock, $0.001 Par Additional paid-in capital Retained earnings Non-controlling interest in equity of subsidiary Total stockholders' equity 0 6 6,131 13,420 6,651 13,733 5,340 13,133 5,539 13,284 0 18,829 180 7,163 11,525 870 19,738 184 8,922 10,345 402 19,852 20,390 19,557 18,479 18,829 29,418 18,479 30,316 1978 34,138 1089 35,153 Total Liabilities and Stockholders' Equity 26,222 26,222 28,941 28,941 29,418 30,316 34,138 35,153
Step by Step Solution
There are 3 Steps involved in it
Step: 1

Get Instant Access to Expert-Tailored Solutions
See step-by-step solutions with expert insights and AI powered tools for academic success
Step: 2

Step: 3

Ace Your Homework with AI
Get the answers you need in no time with our AI-driven, step-by-step assistance
Get Started


