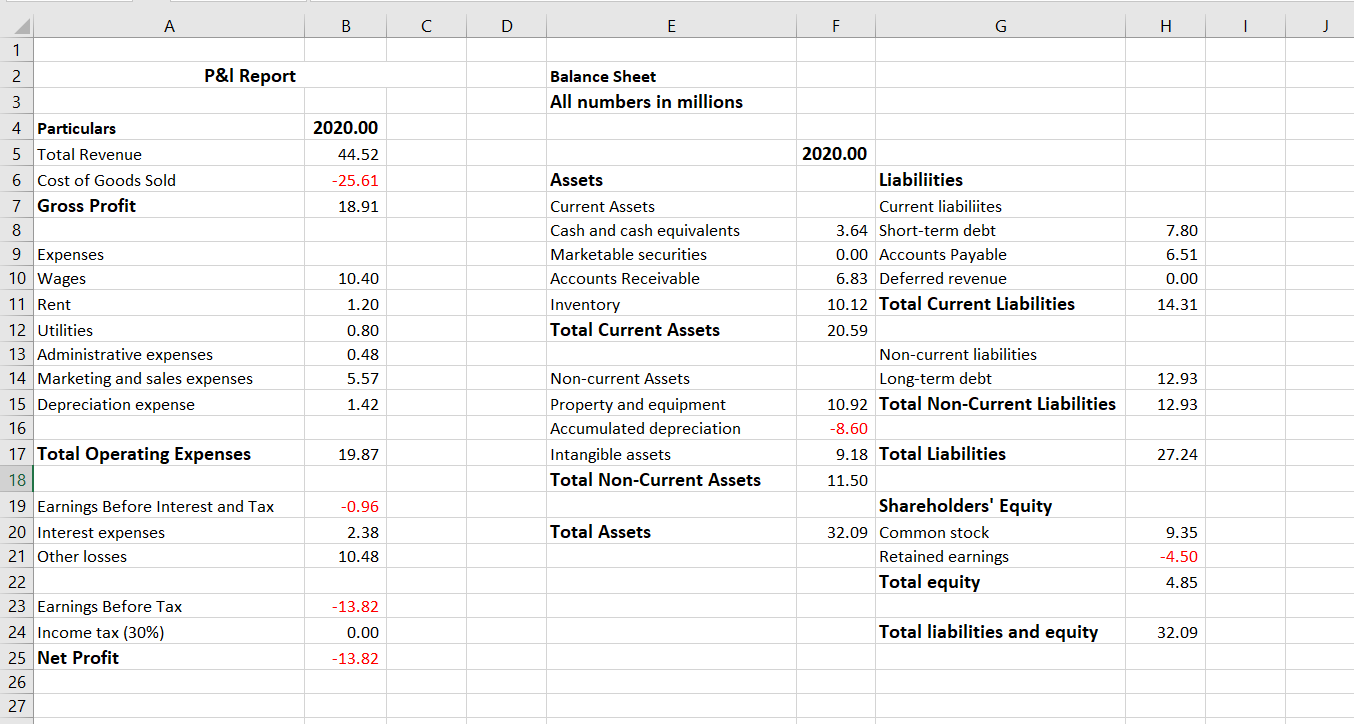
Question
CALCULATE Cost-Volume-Profit Graph, Sales Forecast, Production Forecast, Operating Expenses Forecast, Collections cash flow and Expenses cash flow Financial information for break-even analysis (in USD) On
CALCULATE Cost-Volume-Profit Graph, Sales Forecast, Production Forecast, Operating Expenses Forecast, Collections cash flow and Expenses cash flow

Financial information for break-even analysis (in USD)
On average, the business sells bundles of driver fatigue systems along with the software systems to run them. On average, the revenue from a single sale is worth USD100,000 to ABC LTD
| Average revenue per sale | 100,000 |
|---|---|
| Variable costs per unit sold | |
| Raw materials | 50,000 |
| Direct labour | 7,000 |
| Fixed costs | |
| Wages | 10,400,000 |
| Rent | 1,200,000 |
| Utilities | 800,000 |
| Admin expenses | 480,000 |
| Marketing and Sales expenses | 6,510,000 |
| Interest expense | 2,380,000 |
The following table provides the unit sales for 2019 and 2018. Based on the total revenue for 2020 and the unit price per sale you should be able to determine the total number of unit sales in 2020
| YeaR | 2020 | 2019 | 2018 |
| Unit sales | ? | 592 | 587 |
The following information is provided to you by the company Accountant. The following provides the sales and production forecasts for 2021 and should be used to generate the operating budget for 2021.
Note: The production forecast will match the sales forecast in terms of units.
Sales Information
While the average unit sale is USD100,000, there are three major products ABC LTD sells to its clients:
| Products | Unit price (in USD) |
| Driver fatigue system 1 | 105,000 |
| Driver fatigue system 2 | 97,000 |
| Driver fatigue system 3 | 98,000 |
The following unit sales are expected for the 2021 financial year.
| Products | Q1 | Q2 | Q3 | Q4 |
|---|---|---|---|---|
| Driver fatigue system 1 | 30 | 30 | 32 | 32 |
| Driver fatigue system 2 | 46 | 46 | 44 | 44 |
| Driver fatigue system 3 | 38 | 38 | 36 | 36 |
The following information provides you with the Cost of Goods Sold per unit.
| Products | Cost of Goods Sold (in USD) |
|---|---|
| Driver fatigue system 1 | 59,850 |
| Driver fatigue system 2 | 55,290 |
| Driver fatigue system 3 | 55,860 |
The following is the information provided with regards to the expenses. The following are the annual expenses for the company. They are expected to be paid evenly over the four quarters.
| Expenses | Amount (in USD) |
| Wages | 11,200,000 |
| Rent | 1,300,000 |
| Utilities | 800,000 |
| Admin Expenses | 480,000 |
| Marketing and Sales Expenses | 6,120,000 |
| Interest Expenses | 2,300,000 |
| Tax Expense* | 10% of quarterly sales |
*Note, companies pay a 10% Goods and Services Tax. Each quarter they pay the Tax Office 10% of all sales for that quarter.
The board has asked you to create a cash budget for the first three months of the year. This would coincide with quarter 1.
Sales Information
The Accountant has predicted the following sales for the first three months:
| Particulars | Jan | Feb | Mar |
|---|---|---|---|
| Sales (in USD) | 3,578,666 | 3,778,666 | 3,978,666 |
Collections Information
Based on historical collections information the following collections are expected. For the purpose of this exercise assume there are no outstanding sales to collect from the previous financial year:
| Period | Percentage of collections |
|---|---|
| Collections from the current month | 20% |
| Collections from one month ago | 20% |
| Collections from two months ago | 60% |
Cost of Goods Sold Information
The Cost of Goods sold rate is 57% of the total sales. ABC LTD has quite good payment terms with its creditors. In determining when the Cost of Goods sold is actually paid you should use the Days Payables Outstanding value from the Operating Cash Cycle. Assume there are no outstanding Cost of Goods sold to be paid from the previous financial year.
Expenses Information
The quarterly expenses are spread evenly over the three months. All expenses, except tax expenses, are paid in the same month. The tax expense for the first quarter is paid at the end of March.
A B D E F G H J 1 2 P&I Report Balance Sheet 3 All numbers in millions 4 Particulars 2020.00 5 Total Revenue 44.52 2020.00 6 Cost of Goods Sold -25.61 Assets Liabilities 18.91 Current Assets Current liabiliites 7 Gross Profit 8 Cash and cash equivalents 3.64 Short-term debt 7.80 Marketable securities 6.51 0.00 Accounts Payable 6.83 Deferred revenue 10.40 Accounts Receivable 0.00 1.20 Inventory 10.12 Total Current Liabilities 14.31 9 Expenses 10 Wages 11 Rent 12 Utilities 13 Administrative expenses 14 Marketing and sales expenses 15 Depreciation expense 0.80 Total Current Assets 20.59 0.48 Non-current liabilities 5.57 Non-current Assets 12.93 Long-term debt 10.92 Total Non-Current Liabilities 1.42 12.93 Property and equipment Accumulated depreciation 16 -8.60 17 Total Operating Expenses 19.87 9.18 Total Liabilities 27.24 Intangible assets Total Non-Current Assets 18 11.50 -0.96 Shareholders' Equity 19 Earnings Before Interest and Tax 20 Interest expenses 21 Other losses 2.38 Total Assets 32.09 Common stock 9.35 10.48 -4.50 Retained earnings Total equity 22 4.85 -13.82 23 Earnings Before Tax 24 Income tax (30%) 25 Net Profit 0.00 Total liabilities and equity 32.09 - 13.82 26 27 A B D E F G H J 1 2 P&I Report Balance Sheet 3 All numbers in millions 4 Particulars 2020.00 5 Total Revenue 44.52 2020.00 6 Cost of Goods Sold -25.61 Assets Liabilities 18.91 Current Assets Current liabiliites 7 Gross Profit 8 Cash and cash equivalents 3.64 Short-term debt 7.80 Marketable securities 6.51 0.00 Accounts Payable 6.83 Deferred revenue 10.40 Accounts Receivable 0.00 1.20 Inventory 10.12 Total Current Liabilities 14.31 9 Expenses 10 Wages 11 Rent 12 Utilities 13 Administrative expenses 14 Marketing and sales expenses 15 Depreciation expense 0.80 Total Current Assets 20.59 0.48 Non-current liabilities 5.57 Non-current Assets 12.93 Long-term debt 10.92 Total Non-Current Liabilities 1.42 12.93 Property and equipment Accumulated depreciation 16 -8.60 17 Total Operating Expenses 19.87 9.18 Total Liabilities 27.24 Intangible assets Total Non-Current Assets 18 11.50 -0.96 Shareholders' Equity 19 Earnings Before Interest and Tax 20 Interest expenses 21 Other losses 2.38 Total Assets 32.09 Common stock 9.35 10.48 -4.50 Retained earnings Total equity 22 4.85 -13.82 23 Earnings Before Tax 24 Income tax (30%) 25 Net Profit 0.00 Total liabilities and equity 32.09 - 13.82 26 27Step by Step Solution
There are 3 Steps involved in it
Step: 1

Get Instant Access to Expert-Tailored Solutions
See step-by-step solutions with expert insights and AI powered tools for academic success
Step: 2

Step: 3

Ace Your Homework with AI
Get the answers you need in no time with our AI-driven, step-by-step assistance
Get Started


