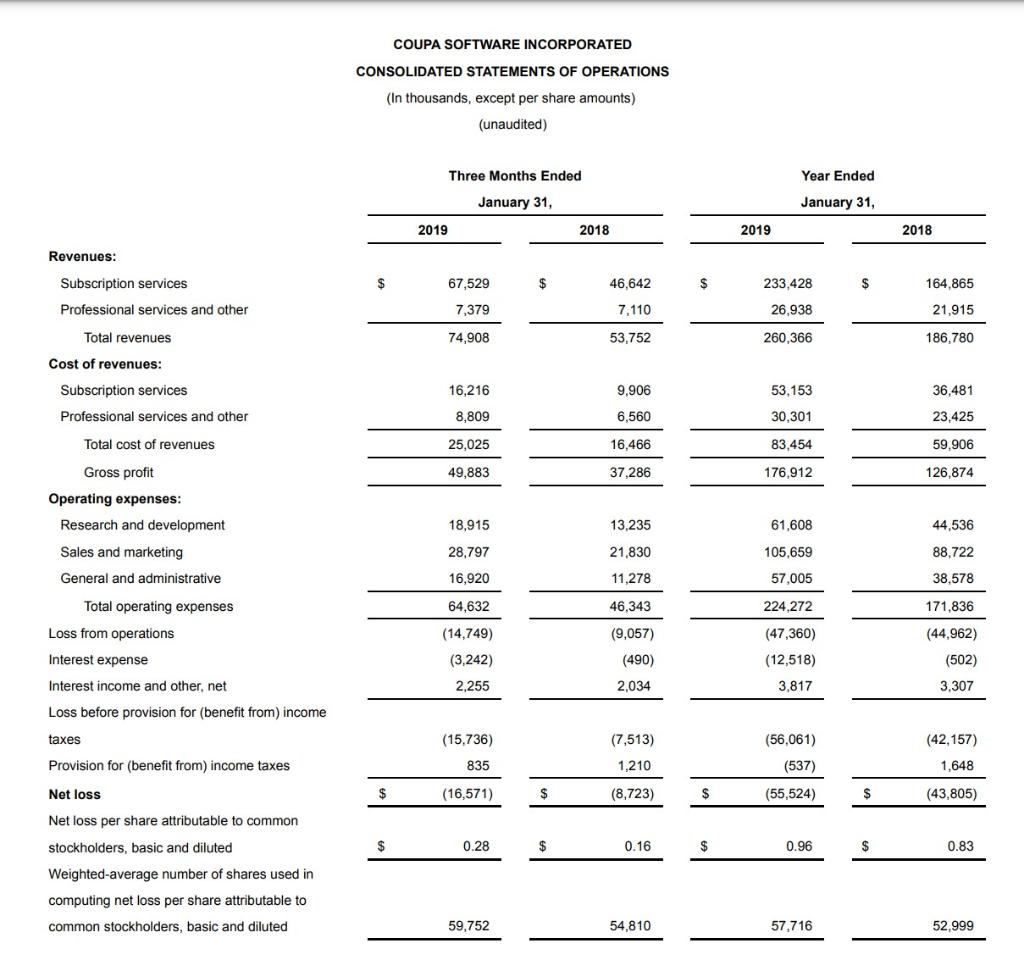
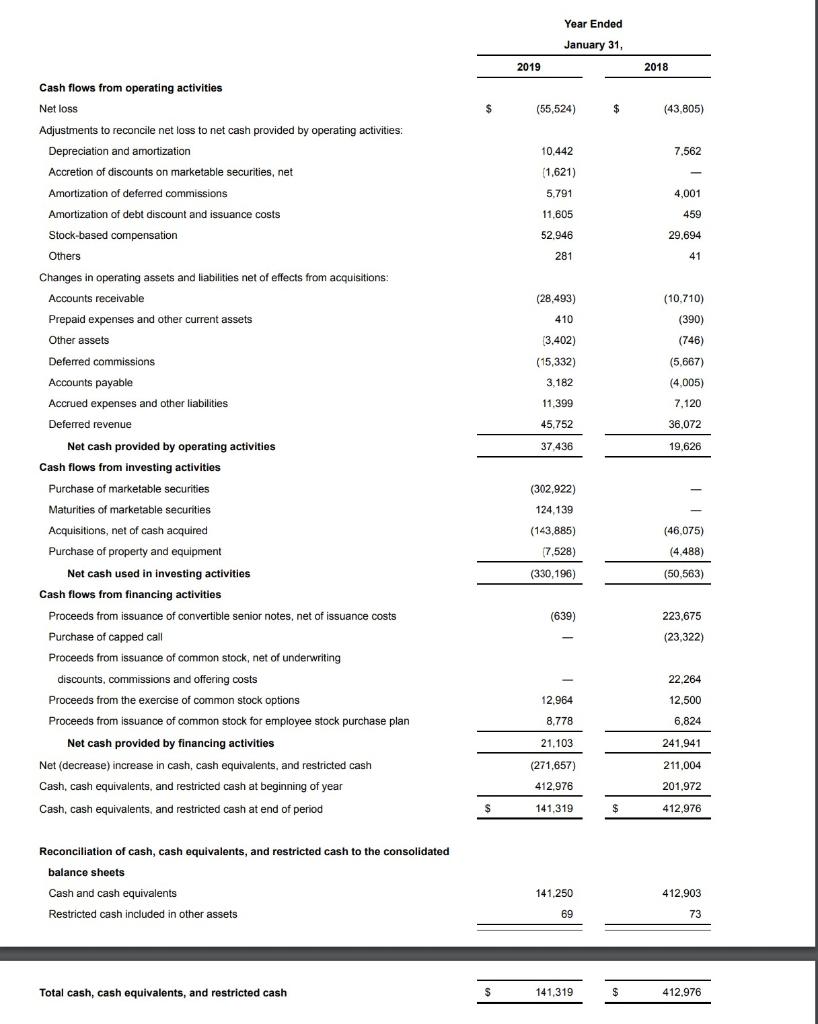
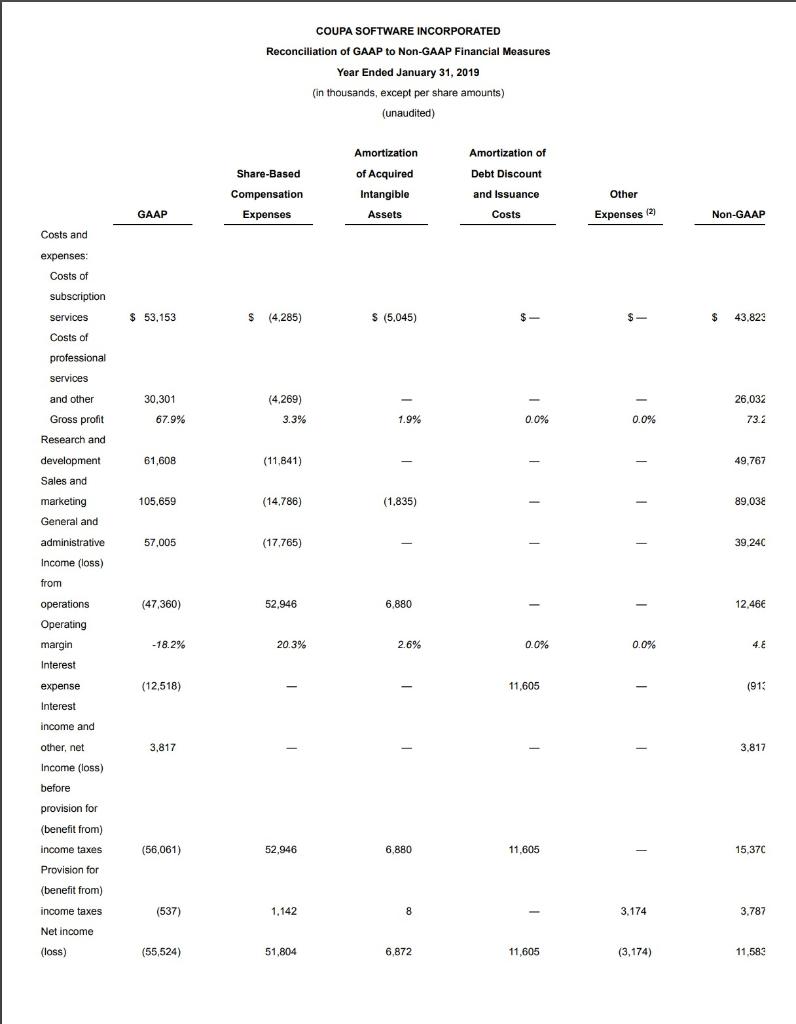
Calculate Coupas EBITDA for 12 months ended January 31, 2019. Coupa does not explicitly define EBITDA. For the purpose of this calculation, assume that EBITDA is normalized for the non-GAAP items Coupa explicitly defines in its non-GAAP reconciliation.


COUPA SOFTWARE INCORPORATED CONSOLIDATED STATEMENTS OF OPERATIONS (In thousands, except per share amounts) (unaudited) Three Months Ended Year Ended January 31, January 31, 2019 2018 2019 2018 Revenues: $ 67,529 $ 46,642 $ 233,428 $ 164,865 Subscription services Professional services and other 7,379 7,110 26,938 21,915 Total revenues 74,908 53,752 260.366 186,780 Cost of revenues: 16,216 9,906 53,153 36,481 Subscription services Professional services and other 8,809 6,560 30,301 23,425 Total cost of revenues 25,025 16,466 83,454 59,906 49,883 37,286 176,912 126,874 Gross profit Operating expenses: Research and development Sales and marketing 18,915 13.235 61,608 44,536 28,797 21,830 105.659 88,722 General and administrative 16,920 11,278 57,005 38,578 Total operating expenses 64,632 46,343 224,272 171,836 Loss from operations (47,360) (44,962) (14,749) (3,242) Interest expense (9,057) (490) 2,034 (12,518) 3,817 (502) 3,307 Interest income and other, net 2,255 Loss before provision for (benefit from) income (7,513) (56,061) (42,157) taxes Provision for (benefit from) income taxes (15,736) 835 1,210 (537) 1,648 Net loss $ (16,571) $ (8,723) $ (55,524) $ (43,805) Net loss per share attributable to common stockholders, basic and diluted $ 0.28 $ 0.16 $ 0.96 $ 0.83 Weighted average number of shar used in computing net loss per share attributable to common stockholders, basic and diluted 59,752 54,810 57,716 52,999 Year Ended January 31, 2019 2018 $ (55,524) $ (43,805) 10,442 7,562 (1,621) - 5,791 4,001 459 11.605 52.946 29.694 281 41 Cash flows from operating activities Net loss Adjustments to reconcile net loss to net cash provided by operating activities: Depreciation and amortization Accretion of discounts on marketable securities, net Amortization of deferred commissions Amortization of debt discount and issuance costs Stock-based compensation Others Changes in operating assets and liabilities net of effects from acquisitions: : Accounts receivable Prepaid expenses and other current assets Other assets Deferred commissions Accounts payable Accrued expenses and other liabilities Deferred revenue Net cash provided by operating activities Cash flows from investing activities Purchase of marketable securities Maturities of marketable securities (28,493) 410 (3,402) (10,710) ) (390) (746) (5,667) (4.005) (15,332) 3.182 11.399 7,120 45,752 36,072 37,436 19,626 (302,922) 124,139 (143,885) (7,528) ) (46,075) (4,488) (330,196) () (50,563) (639) 223,675 (23,322) Acquisitions, net of cash acquired Purchase of property and equipment Net cash used in investing activities Cash flows from financing activities Proceeds from issuance of convertible senior notes, net of issuance costs Purchase of capped call Proceeds from issuance of common stock, net of underwriting , discounts, commissions and offering costs Proceeds from the exercise of common stock options Proceeds from issuance of common stock for employee stock purchase plan Net cash provided by financing activities Net (decrease) increase in cash, cash equivalents, and restricted cash Cash, cash equivalents, and restricted cash at beginning of year Cash, cash equivalents, and restricted cash at end of period 22,264 12.964 8,778 12,500 6,824 21.103 241.941 (271,657) 412.976 211,004 201.972 $ 141,319 $ 412,976 Reconciliation of cash, cash equivalents, and restricted cash to the consolidated balance sheets Cash and cash equivalents 141,250 412.903 Restricted cash included in other assets 69 73 Total cash, cash equivalents, and restricted cash $ 141,319 $ 412.976 COUPA SOFTWARE INCORPORATED Reconciliation of GAAP to Non-GAAP Financial Measures Year Ended January 31, 2019 (in thousands, except per share amounts) (unaudited) Amortization of Debt Discount Share-Based Compensation Expenses Amortization of Acquired Intangible Assets and Issuance Other GAAP Costs Expenses (2) Non-GAAP Costs and expenses: Costs of subscription services Costs of $ 53,153 $ (4.285) S (5.045) $ $ 43,823 professional services and other 30,301 (4.269) 26.032 67.9% 3.3% 1.9% 0.0% 0.0% 73.2 81,608 (11,841) 49,767 Gross profit Research and development Sales and marketing General and 105.659 (14.786) (1.835) 89,038 57,005 (17,765) 39 240 administrative Income (loss) ) from operations Operating margin Interest (47,360) 52.946 6.880 - 12.46 -18.2% 20.3% 2.6% 0.0% 0.0% 4.E expense (12,518) - 11,605 (913 Interest income and other, net 3,817 - - - - 3,817 Income (loss) (56,061) 52.946 6,880 11,605 15,37C before provision for (benefit from) income taxes Provision for (benefit from) income taxes Net income (loss) (537) 1,142 8 8 3.174 3,787 (55,524) 51,804 6,872 11,605 (3,174) 11.589


