calculate current ratio,
Debt Equity Ratio, Gross Profit Ratio, Net Profit Ratio, Return on Equity, Price Earning Ration and Earning per share. 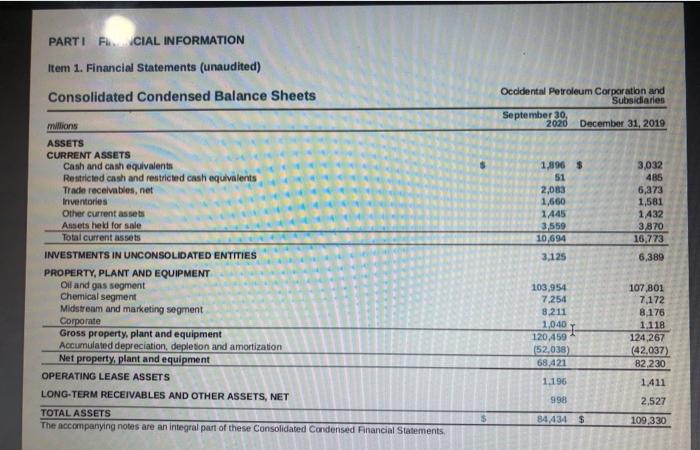
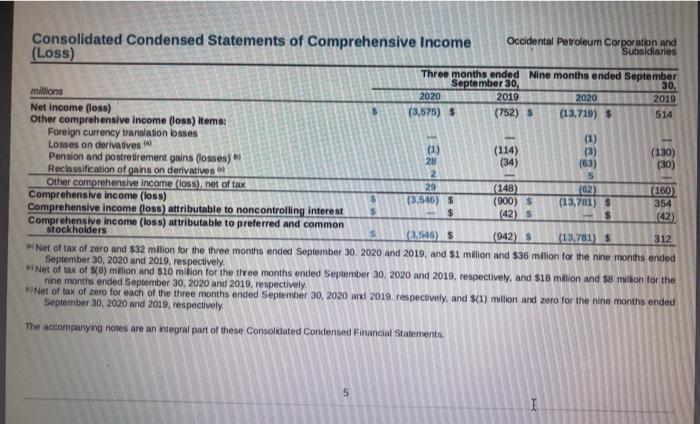
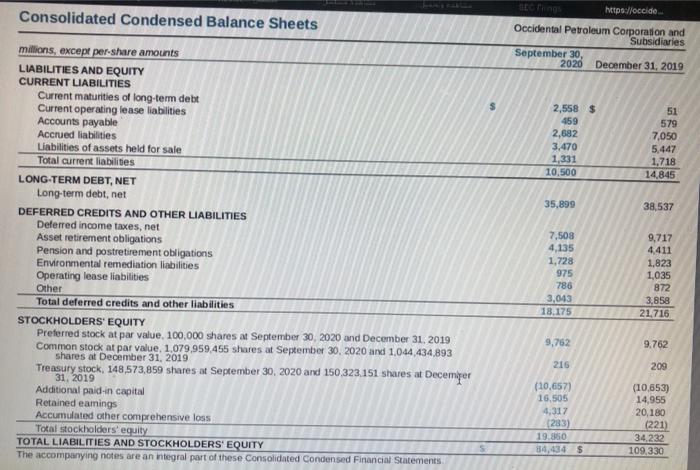
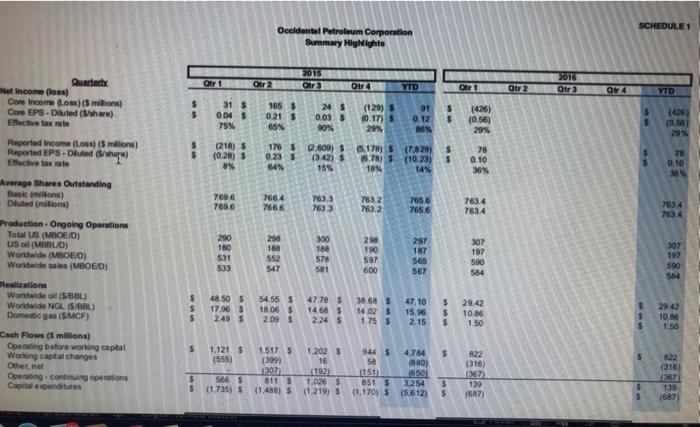
PARTI RCIAL INFORMATION Item 1. Financial Statements (unaudited) Consolidated Condensed Balance Sheets Occidental Petroleum Corporation and Subsidiaries September 30, 2020 December 31, 2019 1,896 $ 51 2,083 1,660 1445 3,559 10,694 3,032 485 6,373 1,581 1432 3870 16,773 3.125 6,389 millions ASSETS CURRENT ASSETS Cash and cash equivalents Restricted cash and restricted cash equivalents Trade receivables, net Inventories Other current assets Assets held for sale Total current assets INVESTMENTS IN UNCONSOLIDATED ENTITIES PROPERTY, PLANT AND EQUIPMENT Oil and gas segment Chemical segment Midstream and marketing segment Corporate Gross property, plant and equipment Accumulated depreciation, depletion and amortization Net property, plant and equipment OPERATING LEASE ASSETS LONG-TERM RECEIVABLES AND OTHER ASSETS, NET TOTAL ASSETS The accompanying notes are an integral part of these Consolidated Condensed Financial Statements 103,954 7.254 8.211 1,040 107,801 7.172 8176 1.118 124,267 (42,037) 82,230 120.450 (52,038) 68,421 1.196 1.411 2,527 998 84,434 $ 109,330 [ Consolidated Condensed Statements of Comprehensive Income Occidental Petroleum Corporation and (Loss) Subsidiaries Three months ended Nine months ended September September 30, 30, millions 2020 2019 2020 2019 Net Income (losa) (3,575) $ (752) 5 (13,719) $ Other comprehensive income (oss) items: 514 Foreign currency translation losses (1) Losses on derivatives (1) (114) Pension and postretirement gains (losses) (3) (130) 28 (34) (63) (30) Reclassification of ganson derivatives 2 5 Other comprehensive Income (loss)net of tax 29 (148) 62) Comprehensive income (loss) (160) (3.546) $ (900) 5 Comprehensive Income (loss) attributable to noncontrolling interest (13,781) $ 354 $ $ (42) Comprehensive income (loss) attributable to preferred and common stockholders $ (1.546) $ (942) S (13,781) $ 312 Net of tax of zero and $32 million for the three months ended September 30, 2020 and 2019, and $1 million and $36 million for the nine months ended September 30, 2020 and 2019, respectively, Net of tax of S) milion and $10 million for the tivee months ended September 30, 2020 and 2019, respectively, and $18 million and S8 million for the nine months ended September 30, 2020 and 2019. respectively Net of tax of zero for each of the three months ended September 30, 2020 and 2019. respectively, and S(1) million and zero for the nine months ended September 30, 2020 and 2019, respectively ses de The accompanying notes are an integral part of these consolidated Condensed Financial Statements 5 Consolidated Condensed Balance Sheets org https://occide Occidental Petroleum Corporation and Subsidiaries September 30, 2020 December 31, 2019 2,558 $ 459 2,682 3,470 1,331 10,500 51 579 7,050 5,447 1,718 14,845 35,899 38,537 millions, except per share amounts LIABILITIES AND EQUITY CURRENT LIABILITIES Current maturities of long-term debt Current operating lease liabilities Accounts payable Accrued liabilities Liabilities of assets held for sale Total current liabilities LONG-TERM DEBT, NET Long-term debt, net DEFERRED CREDITS AND OTHER LIABILITIES Deferred income taxes, net Asset retirement obligations Pension and postretirement obligations Environmental remediation liabilities Operating lease liabilities Other Total deferred credits and other liabilities STOCKHOLDERS' EQUITY Preferred stock at par value 100,000 shares at September 30, 2020 and December 31, 2019 Common stock at par value 1.079,959,455 shares at September 30, 2020 and 1,044 434,893 Treasury stock, 148,573,850 shares at September 30, 2020 and 150,323151 shares at Decemper 31, 2019 Additional paid in capital Retained eamings Accumulated other comprehensive loss Total stockholders' equity TOTAL LIABILITIES AND STOCKHOLDERS' EQUITY The accompanying notes are an integral part of these Consolidated Condensed Financial Statements 7,508 4,135 1,728 975 786 3,043 18.175 9,717 4,411 1.823 1,035 872 3,858 21.716 9,762 9,762 216 209 (10,657) 16,505 4,317 (283) 19.860 84,434 $ (10.653) 14,955 20,180 (221) 34,232 109,330 SCHEDULE 1 Occidental Petroleum Corporation Summary Highlights 2015 Otr 1 Otr2 Otr 4 YTD Otr 1 2013 Qir 3 Otr 2 O4 YTD Quinctedy Net Income Cone Income foss) (5 milions) Core EPS-Diluted (share) Elective taxe 31 $ 0045 75% 1655 0.21 $ 65% 24 S 0.035 (129) 0.17) 5 2995 91 0.12 80% $ $ (426) (0.56) 29% $ (06 10.50 90% Reported Income (Loss) (5 milions) uported EPS. Daud Effective text (218) (0.28) 5 8 176 $ 0.235 64N 0.600) (342) 15% 178) $ (7.820) (6.78) 5 (10-23) 18 14% $ $ 78 0.10 36% 78 0.10 769.6 7696 7664 7666 7633 7633 7632 7632 765.6 7656 7634 7634 703.4 Average Shares Outstanding Basisons) Duted (min) Production. Ongoing Operation Total US (MOED) USol (MBBLID) Worldwide (MBOED) Worldwide sales (MOED) 297 280 180 531 533 290 180 552 547 300 180 578 581 298 190 597 600 565 567 307 197 590 584 307 197 500 554 47.10 $ $ 48.50 5 17 96 S 2495 54.55$ 18.065 2.09 $ 47.78 5 14.685 2.24 5 38.68 $ 14 02 $ 1 75$ 15.98 2.15 $ $ $ 29.42 10.86 150 2942 10.86 1.50 Restione Worldwide (S/BBL) Worldwide NGL (S/BBL) Domestic gas (SMCF) Cash Flows (5 millions) Operating before working capital Working capital changes Othernet Operating continuing operations Capitoxpenditures 5 1.1215 (555) 1.202 $ 5 16 1,517 5 (3991 20 811 5 (1488) 5 9445 50 150 851 5 11.170) S 4.784 1880) 1650) 3.254 15,612) $ 5665 (1.735) 1,026 5 (1219) S 5 $ (316) 2007 139 (687) (316) (367) 133 1887) 5 5 PARTI RCIAL INFORMATION Item 1. Financial Statements (unaudited) Consolidated Condensed Balance Sheets Occidental Petroleum Corporation and Subsidiaries September 30, 2020 December 31, 2019 1,896 $ 51 2,083 1,660 1445 3,559 10,694 3,032 485 6,373 1,581 1432 3870 16,773 3.125 6,389 millions ASSETS CURRENT ASSETS Cash and cash equivalents Restricted cash and restricted cash equivalents Trade receivables, net Inventories Other current assets Assets held for sale Total current assets INVESTMENTS IN UNCONSOLIDATED ENTITIES PROPERTY, PLANT AND EQUIPMENT Oil and gas segment Chemical segment Midstream and marketing segment Corporate Gross property, plant and equipment Accumulated depreciation, depletion and amortization Net property, plant and equipment OPERATING LEASE ASSETS LONG-TERM RECEIVABLES AND OTHER ASSETS, NET TOTAL ASSETS The accompanying notes are an integral part of these Consolidated Condensed Financial Statements 103,954 7.254 8.211 1,040 107,801 7.172 8176 1.118 124,267 (42,037) 82,230 120.450 (52,038) 68,421 1.196 1.411 2,527 998 84,434 $ 109,330 [ Consolidated Condensed Statements of Comprehensive Income Occidental Petroleum Corporation and (Loss) Subsidiaries Three months ended Nine months ended September September 30, 30, millions 2020 2019 2020 2019 Net Income (losa) (3,575) $ (752) 5 (13,719) $ Other comprehensive income (oss) items: 514 Foreign currency translation losses (1) Losses on derivatives (1) (114) Pension and postretirement gains (losses) (3) (130) 28 (34) (63) (30) Reclassification of ganson derivatives 2 5 Other comprehensive Income (loss)net of tax 29 (148) 62) Comprehensive income (loss) (160) (3.546) $ (900) 5 Comprehensive Income (loss) attributable to noncontrolling interest (13,781) $ 354 $ $ (42) Comprehensive income (loss) attributable to preferred and common stockholders $ (1.546) $ (942) S (13,781) $ 312 Net of tax of zero and $32 million for the three months ended September 30, 2020 and 2019, and $1 million and $36 million for the nine months ended September 30, 2020 and 2019, respectively, Net of tax of S) milion and $10 million for the tivee months ended September 30, 2020 and 2019, respectively, and $18 million and S8 million for the nine months ended September 30, 2020 and 2019. respectively Net of tax of zero for each of the three months ended September 30, 2020 and 2019. respectively, and S(1) million and zero for the nine months ended September 30, 2020 and 2019, respectively ses de The accompanying notes are an integral part of these consolidated Condensed Financial Statements 5 Consolidated Condensed Balance Sheets org https://occide Occidental Petroleum Corporation and Subsidiaries September 30, 2020 December 31, 2019 2,558 $ 459 2,682 3,470 1,331 10,500 51 579 7,050 5,447 1,718 14,845 35,899 38,537 millions, except per share amounts LIABILITIES AND EQUITY CURRENT LIABILITIES Current maturities of long-term debt Current operating lease liabilities Accounts payable Accrued liabilities Liabilities of assets held for sale Total current liabilities LONG-TERM DEBT, NET Long-term debt, net DEFERRED CREDITS AND OTHER LIABILITIES Deferred income taxes, net Asset retirement obligations Pension and postretirement obligations Environmental remediation liabilities Operating lease liabilities Other Total deferred credits and other liabilities STOCKHOLDERS' EQUITY Preferred stock at par value 100,000 shares at September 30, 2020 and December 31, 2019 Common stock at par value 1.079,959,455 shares at September 30, 2020 and 1,044 434,893 Treasury stock, 148,573,850 shares at September 30, 2020 and 150,323151 shares at Decemper 31, 2019 Additional paid in capital Retained eamings Accumulated other comprehensive loss Total stockholders' equity TOTAL LIABILITIES AND STOCKHOLDERS' EQUITY The accompanying notes are an integral part of these Consolidated Condensed Financial Statements 7,508 4,135 1,728 975 786 3,043 18.175 9,717 4,411 1.823 1,035 872 3,858 21.716 9,762 9,762 216 209 (10,657) 16,505 4,317 (283) 19.860 84,434 $ (10.653) 14,955 20,180 (221) 34,232 109,330 SCHEDULE 1 Occidental Petroleum Corporation Summary Highlights 2015 Otr 1 Otr2 Otr 4 YTD Otr 1 2013 Qir 3 Otr 2 O4 YTD Quinctedy Net Income Cone Income foss) (5 milions) Core EPS-Diluted (share) Elective taxe 31 $ 0045 75% 1655 0.21 $ 65% 24 S 0.035 (129) 0.17) 5 2995 91 0.12 80% $ $ (426) (0.56) 29% $ (06 10.50 90% Reported Income (Loss) (5 milions) uported EPS. Daud Effective text (218) (0.28) 5 8 176 $ 0.235 64N 0.600) (342) 15% 178) $ (7.820) (6.78) 5 (10-23) 18 14% $ $ 78 0.10 36% 78 0.10 769.6 7696 7664 7666 7633 7633 7632 7632 765.6 7656 7634 7634 703.4 Average Shares Outstanding Basisons) Duted (min) Production. Ongoing Operation Total US (MOED) USol (MBBLID) Worldwide (MBOED) Worldwide sales (MOED) 297 280 180 531 533 290 180 552 547 300 180 578 581 298 190 597 600 565 567 307 197 590 584 307 197 500 554 47.10 $ $ 48.50 5 17 96 S 2495 54.55$ 18.065 2.09 $ 47.78 5 14.685 2.24 5 38.68 $ 14 02 $ 1 75$ 15.98 2.15 $ $ $ 29.42 10.86 150 2942 10.86 1.50 Restione Worldwide (S/BBL) Worldwide NGL (S/BBL) Domestic gas (SMCF) Cash Flows (5 millions) Operating before working capital Working capital changes Othernet Operating continuing operations Capitoxpenditures 5 1.1215 (555) 1.202 $ 5 16 1,517 5 (3991 20 811 5 (1488) 5 9445 50 150 851 5 11.170) S 4.784 1880) 1650) 3.254 15,612) $ 5665 (1.735) 1,026 5 (1219) S 5 $ (316) 2007 139 (687) (316) (367) 133 1887) 5 5