calculate DCF valuation
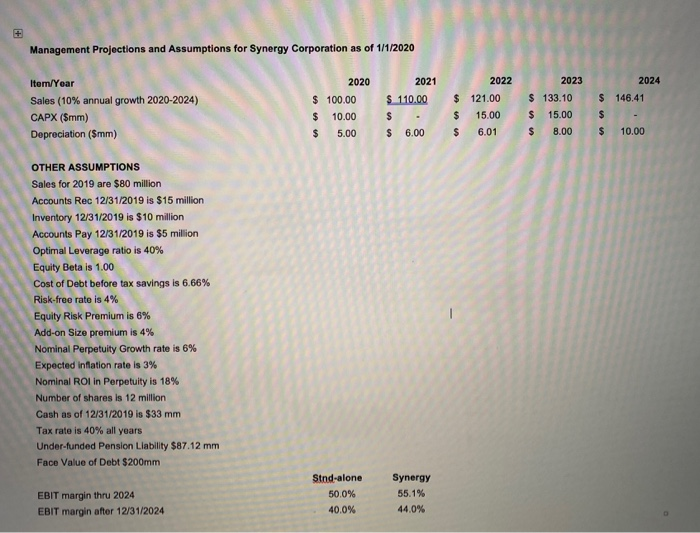
Management Projections and Assumptions for Synergy Corporation as of 1/1/2020 2021 110.00 $ Item/Year Sales (10% annual growth 2020-2024) CAPX (5mm) Depreciation (Smm) 2020 $ 100,00 $ 10.00 $ 5.00 $ $ $ 2022 121.00 15.00 6.01 2023 $ 133.10 $ 15.00 $ 8.00 2024 $ 146.41 $ - $ 10.00 $ 6.00 OTHER ASSUMPTIONS Sales for 2019 are $80 million Accounts Rec 12/31/2019 is $15 million Inventory 12/31/2019 is $10 million Accounts Pay 12/31/2019 is $5 million Optimal Leverage ratio is 40% Equity Beta is 1.00 Cost of Debt before tax savings is 6.66% Risk-free rate is 4% Equity Risk Premium is 6% Add-on Size premium is 4% Nominal Perpetuity Growth rate is 6% Expected inflation rate is 3% Nominal ROI in Perpetuity is 18% Number of shares is 12 million Cash as of 12/31/2019 is $33 mm Tax rate is 40% all years Under-funded Pension Liability $87.12 mm Face Value of Debt $200mm EBIT margin thru 2024 EBIT margin after 12/31/2024 Stnd-alone 50.0% 40.0% Synergy 55.1% 44.0% Management Projections and Assumptions for Synergy Corporation as of 1/1/2020 2021 110.00 $ Item/Year Sales (10% annual growth 2020-2024) CAPX (5mm) Depreciation (Smm) 2020 $ 100,00 $ 10.00 $ 5.00 $ $ $ 2022 121.00 15.00 6.01 2023 $ 133.10 $ 15.00 $ 8.00 2024 $ 146.41 $ - $ 10.00 $ 6.00 OTHER ASSUMPTIONS Sales for 2019 are $80 million Accounts Rec 12/31/2019 is $15 million Inventory 12/31/2019 is $10 million Accounts Pay 12/31/2019 is $5 million Optimal Leverage ratio is 40% Equity Beta is 1.00 Cost of Debt before tax savings is 6.66% Risk-free rate is 4% Equity Risk Premium is 6% Add-on Size premium is 4% Nominal Perpetuity Growth rate is 6% Expected inflation rate is 3% Nominal ROI in Perpetuity is 18% Number of shares is 12 million Cash as of 12/31/2019 is $33 mm Tax rate is 40% all years Under-funded Pension Liability $87.12 mm Face Value of Debt $200mm EBIT margin thru 2024 EBIT margin after 12/31/2024 Stnd-alone 50.0% 40.0% Synergy 55.1% 44.0%