

Answered step by step
Verified Expert Solution
Question
1 Approved Answer
Calculate every ratios for Year 2016 and Year 2015. *Please provide solutions with formulas (in excel). ZXY, Inc. Balance Sheet Financial Year 2016 2015 RM'000
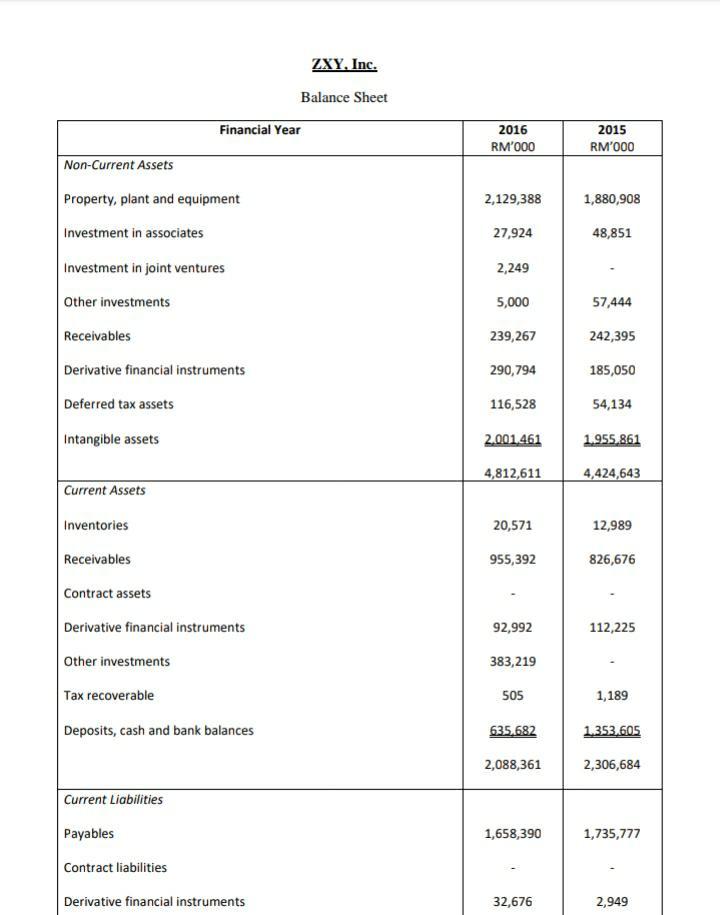
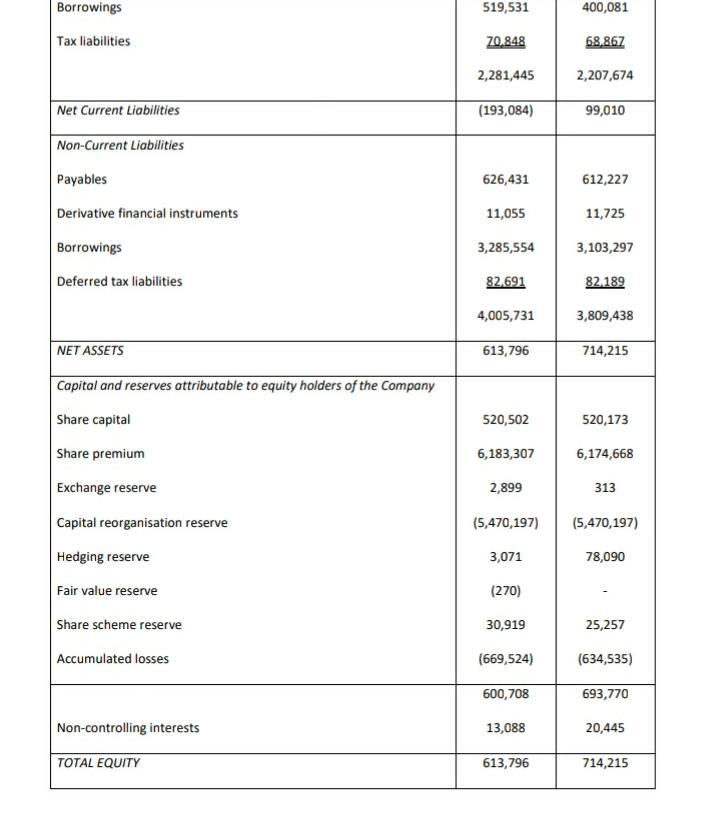
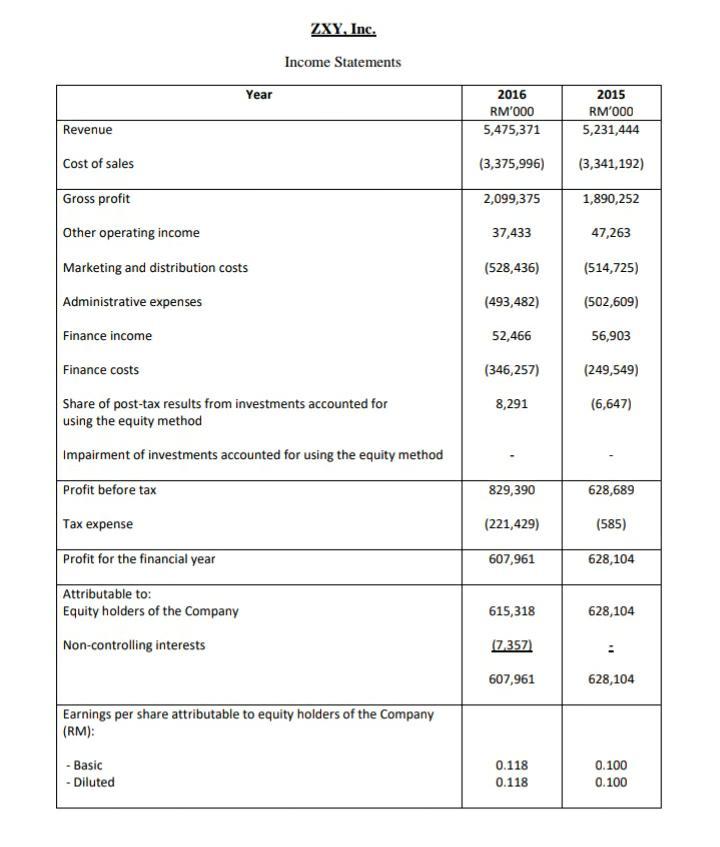
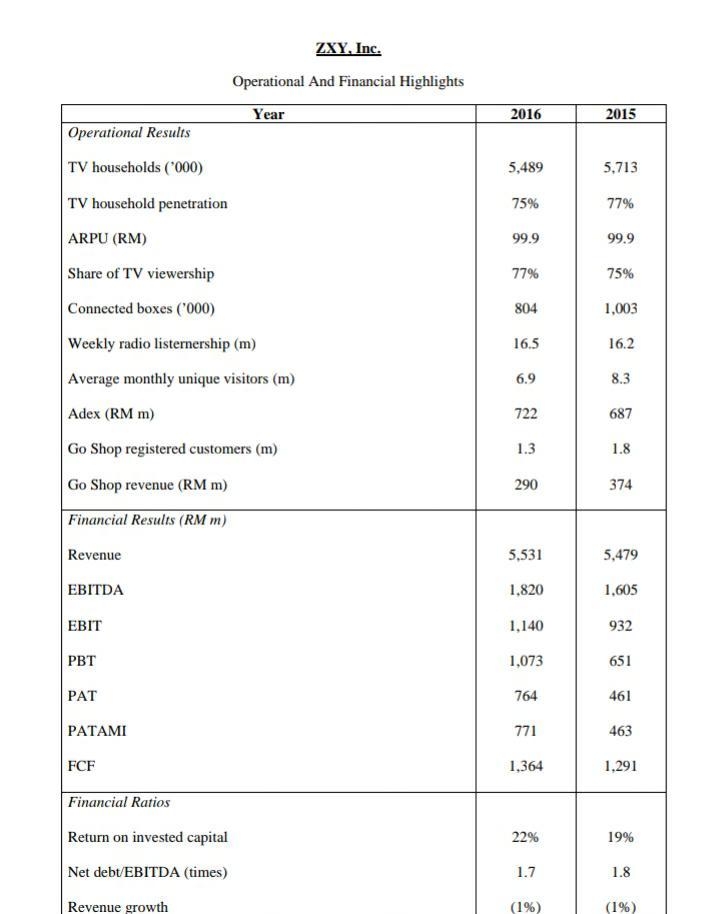
Calculate every ratios for Year 2016 and Year 2015.
*Please provide solutions with formulas (in excel).
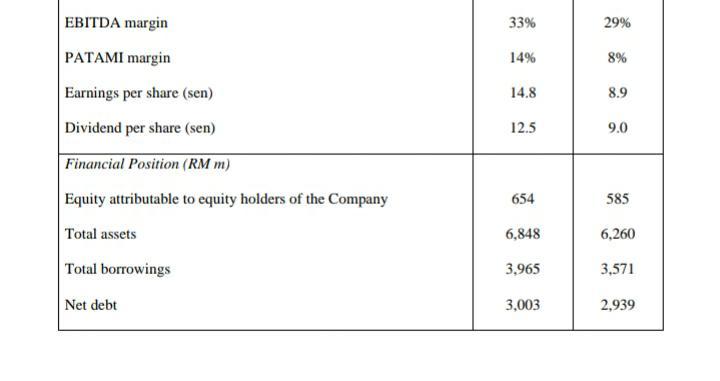
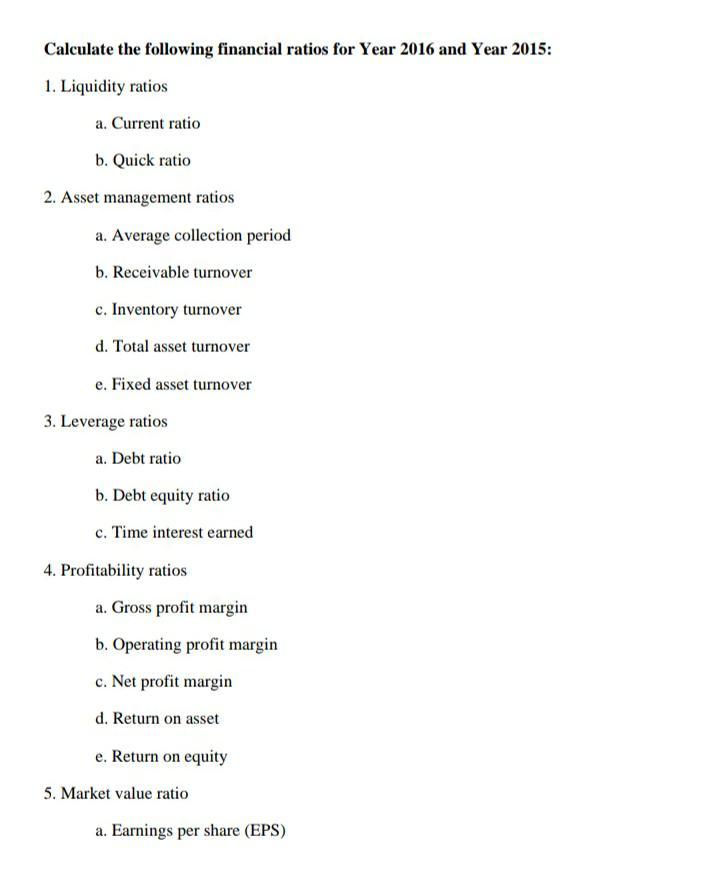
ZXY, Inc. Balance Sheet Financial Year 2016 2015 RM'000 RM'000 Non-Current Assets Property, plant and equipment 2,129,388 1,880,908 27,924 48,851 Investment in associates Investment in joint ventures 2,249 Other investments 5,000 57,444 Receivables 239,267 242,395 Derivative financial instruments 290,794 185,050 Deferred tax assets 116,528 54,134 Intangible assets 2.001.461 1.955,861 4,812,611 4,424,643 Current Assets Inventories 20,571 12,989 955,392 826,676 Receivables Contract assets Derivative financial instruments 92,992 112,225 Other investments 383,219 Tax recoverable 505 1,189 Deposits, cash and bank balances 635.682 1353,605 2,088,361 2,306,684 Current Liabilities Payables 1,658,390 1,735,777 Contract liabilities Derivative financial instruments 32,676 2,949 Borrowings 519,531 400,081 Tax liabilities 70.848 68,867 2,281,445 2,207,674 Net Current Liabilities (193,084) 99,010 Non-Current Liabilities Payables 626,431 612,227 Derivative financial instruments 11,055 11,725 Borrowings 3,285,554 3,103,297 Deferred tax liabilities 82.691 82.189 4,005,731 3,809,438 NET ASSETS 613,796 714,215 Capital and reserves attributable to equity holders of the Company Share capital 520,502 520,173 Share premium 6,183,307 6,174,668 Exchange reserve 2,899 313 Capital reorganisation reserve (5,470,197) (5,470, 197) Hedging reserve 3,071 78,090 Fair value reserve (270) Share scheme reserve 30,919 25,257 Accumulated losses (669,524) (634,535) 600,708 693,770 Non-controlling interests 13,088 20,445 TOTAL EQUITY 613,796 714,215 ZXY, Inc. Income Statements Year 2016 2015 RM'000 RM'000 Revenue 5,475,371 5,231,444 Cost of sales (3,375,996) (3,341,192) Gross profit 2,099,375 1,890,252 Other operating income 37,433 47,263 Marketing and distribution costs (528,436) (514,725) Administrative expenses (493,482) (502,609) Finance income 52,466 56,903 Finance costs (346,257) (249,549) 8,291 (6,647) Share of post-tax results from investments accounted for using the equity method Impairment of investments accounted for using the equity method Profit before tax 829,390 628,689 Tax expense (221,429) (585) Profit for the financial year 607,961 628,104 Attributable to: 615,318 628,104 Equity holders of the Company Non-controlling interests (7.357) 607,961 628,104 Earnings per share attributable to equity holders of the Company (RM): - Basic - Diluted 0.118 0.118 0.100 0.100 ZXY, Inc. Operational And Financial Highlights Year 2016 2015 Operational Results TV households ('000) 5,489 5.713 TV household penetration 75% 77% ARPU (RM) 99.9 99.9 77% 75% 804 1,003 Share of TV viewership Connected boxes ('000) Weekly radio listernership (m) Average monthly unique visitors (m) 16.5 16.2 6.9 8.3 Adex (RM m) 722 687 Go Shop registered customers (m) 1.3 1.8 Go Shop revenue (RM m) 290 374 Financial Results (RM m) Revenue 5,531 5,479 EBITDA 1,820 1,605 EBIT 1,140 932 PBT 1,073 651 PAT 764 461 PATAMI 771 463 FCF 1,364 1,291 Financial Ratios Return on invested capital 22% 19% Net debt/EBITDA (times) 1.7 1.8 Revenue growth (1%) (1%) EBITDA margin 33% 29% PATAMI margin 14% 8% Earnings per share (sen) 14.8 8.9 Dividend per share (sen) 12.5 9.0 Financial Position (RM m) Equity attributable to equity holders of the Company 654 585 Total assets 6,848 6,260 Total borrowings 3,965 3,571 Net debt 3,003 2,939 Calculate the following financial ratios for Year 2016 and Year 2015: 1. Liquidity ratios a. Current ratio b. Quick ratio 2. Asset management ratios a. Average collection period b. Receivable turnover c. Inventory turnover d. Total asset turnover e. Fixed asset turnover 3. Leverage ratios a. Debt ratio b. Debt equity ratio c. Time interest earned 4. Profitability ratios a. Gross profit margin b. Operating profit margin c. Net profit margin d. Return on asset e. Return on equity 5. Market value ratio a. Earnings per share (EPS)Step by Step Solution
There are 3 Steps involved in it
Step: 1

Get Instant Access to Expert-Tailored Solutions
See step-by-step solutions with expert insights and AI powered tools for academic success
Step: 2

Step: 3
Ace Your Homework with AI
Get the answers you need in no time with our AI-driven, step-by-step assistance
Get Started
Fundamentals Of Financial Management
Authors: James Van Horne, John Wachowicz
13th Revised Edition
978-0273713630, 273713639