

Answered step by step
Verified Expert Solution
Question
1 Approved Answer
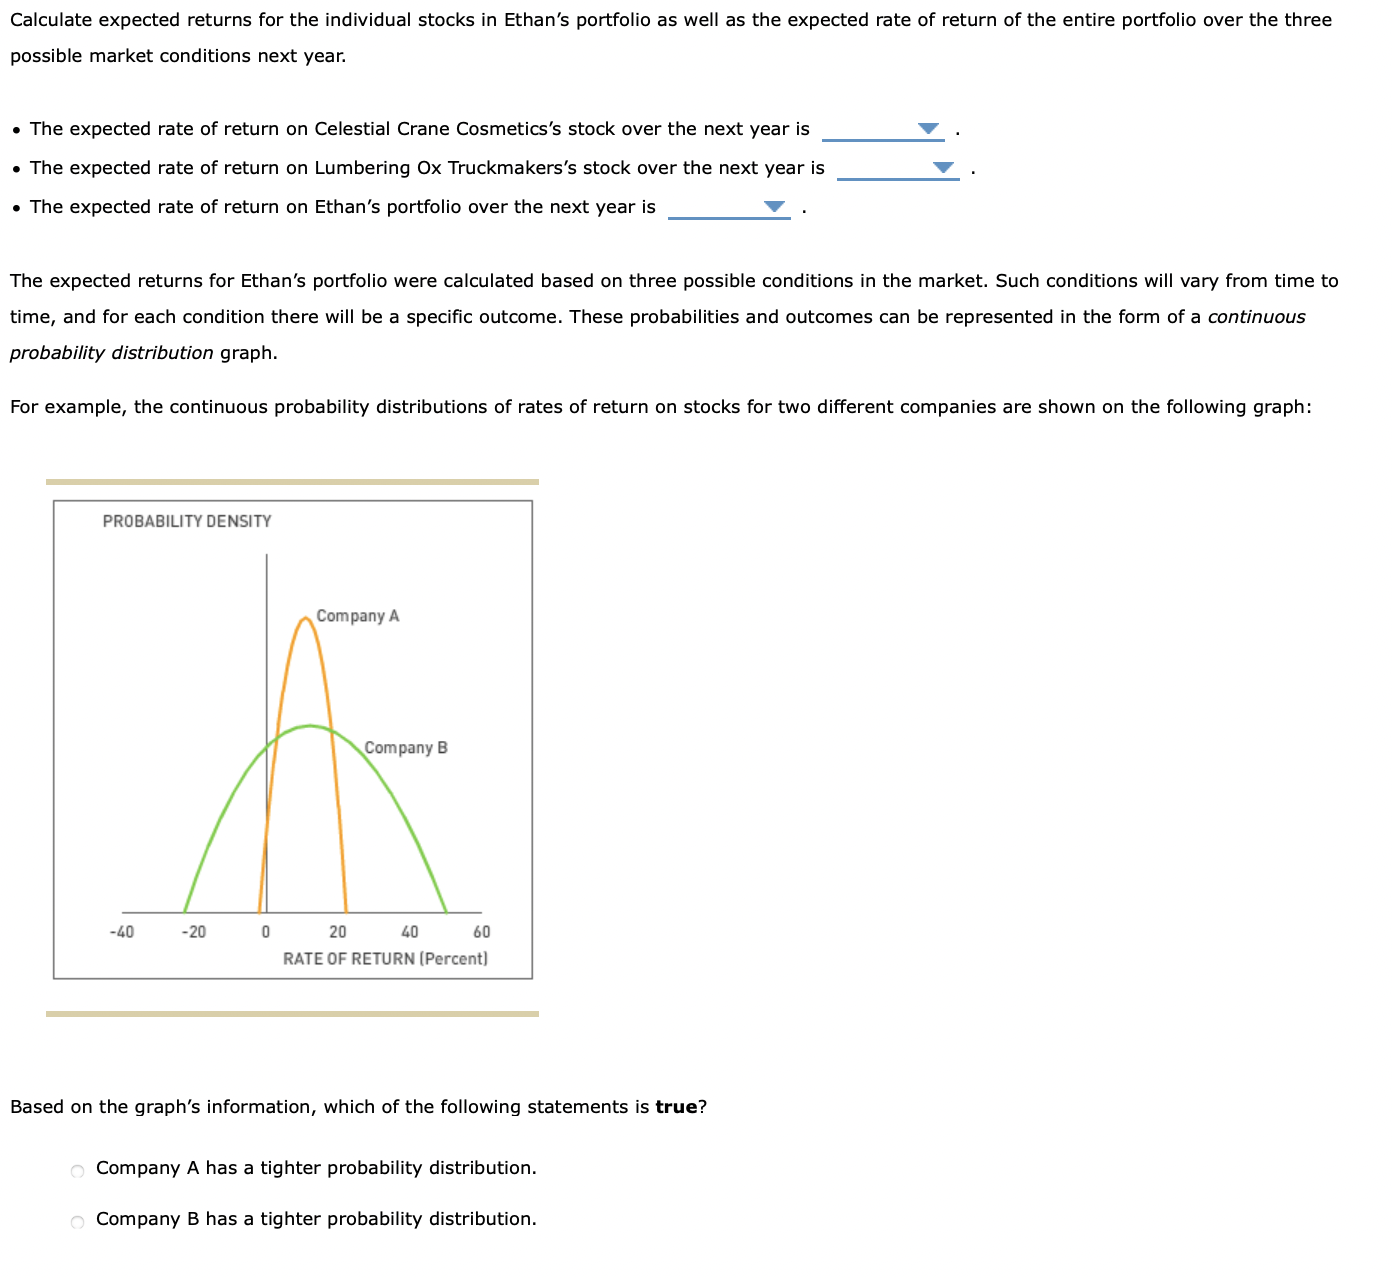
Calculate expected returns for the individual stocks in Ethan's portfolio as well as the expected rate of return of the entire portfolio over the three
Step by Step Solution
There are 3 Steps involved in it
Step: 1

Get Instant Access to Expert-Tailored Solutions
See step-by-step solutions with expert insights and AI powered tools for academic success
Step: 2

Step: 3
Ace Your Homework with AI
Get the answers you need in no time with our AI-driven, step-by-step assistance
Get Started
Personal Finance An Integrated Planning Approach
Authors: Ralph R Frasca
8th edition
136063039, 978-0136063032