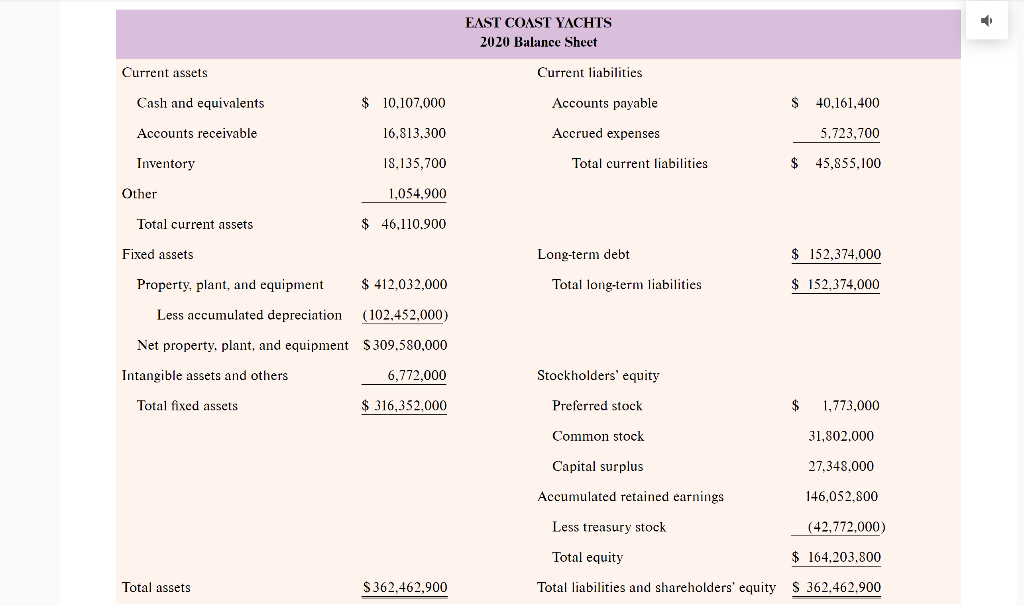
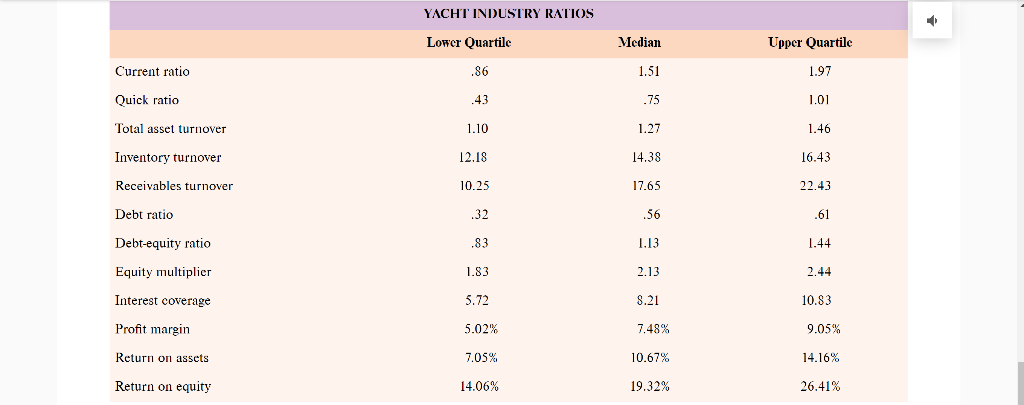
Calculate financial ratios for East Coast and compare them to their industry. What conclusions do you draw?
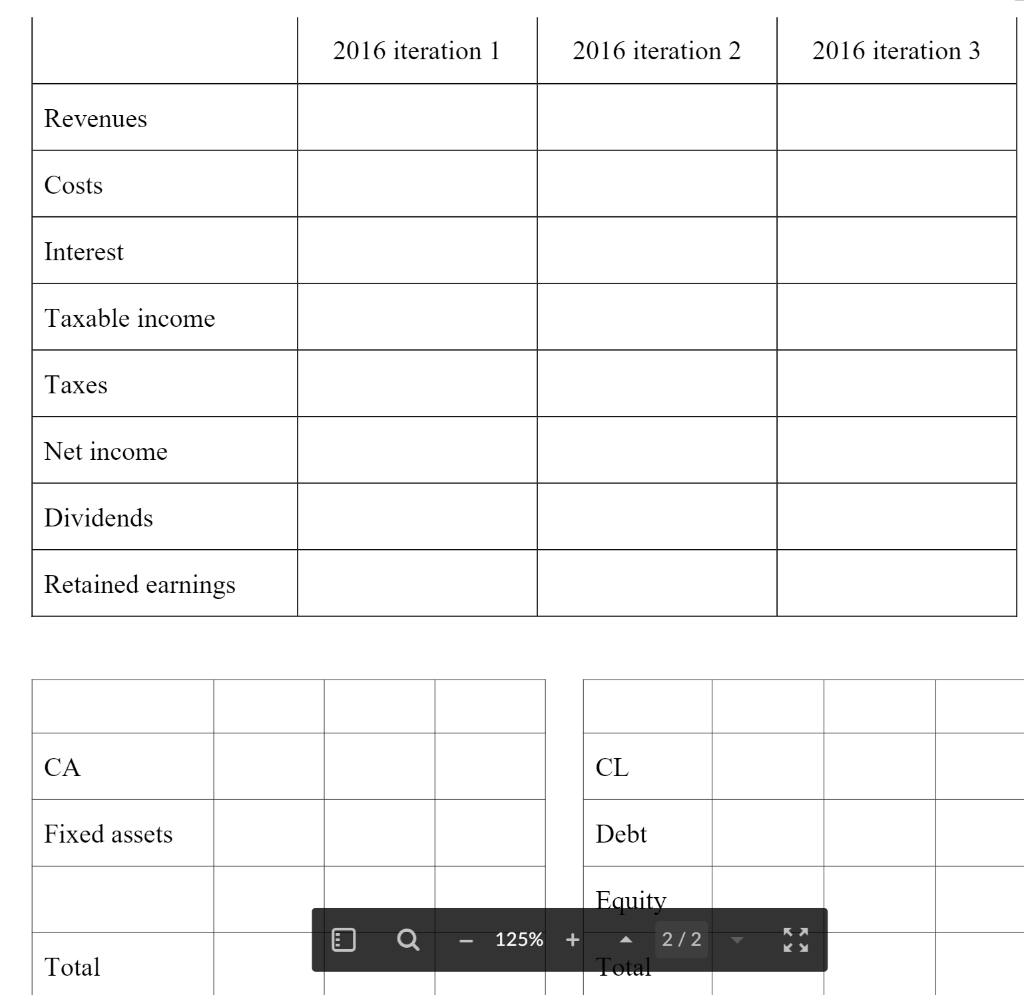
- Complete proforma for the next year. Assume:
- Sales grow at 20%.
- The firm stays as efficient as they currently are.
- The firm would keep the same dividend payout ratio.
Use Chart Below for ProForma

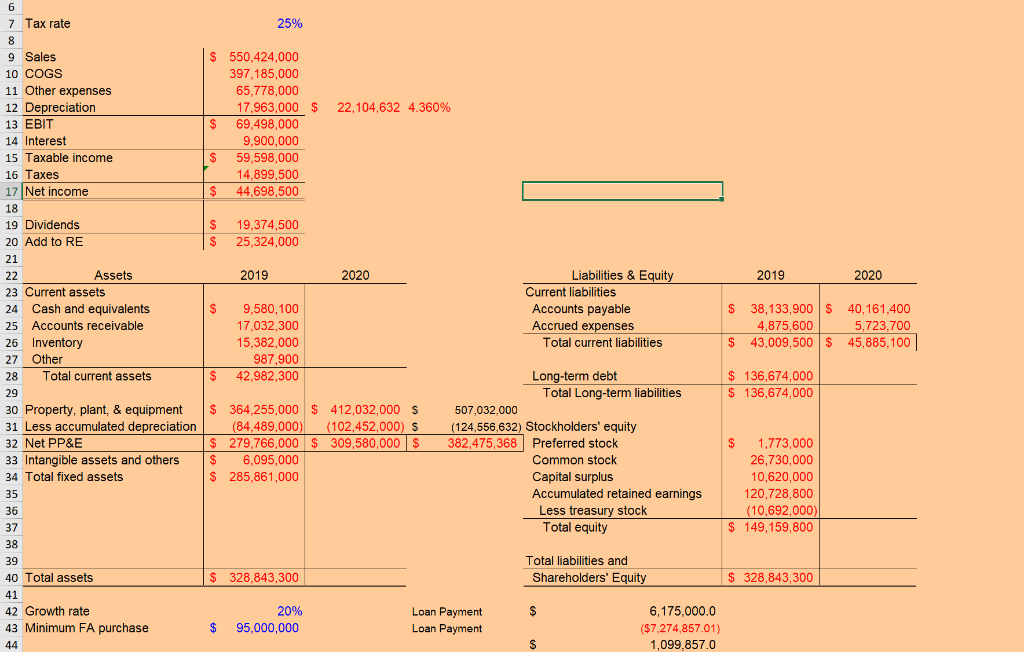
Supporting Data Below


2016 iteration 1 2016 iteration 2 2016 iteration 3 Revenues Costs Interest Taxable income Taxes Net income Dividends Retained earnings CA CL Fixed assets Debt Equity 125% + 2/2 Total Total EAST COAST YACHTS 2020 Income Statement Sales $ 550,424,000 Cost of goods sold 397,185,000 Selling, general, and administrative 65,778,000 Depreciation 17,963,000 EBIT 69,498,000 Interest expense 9,900,000 EBT 59,598,000 Taxes (25%) 14,899,500 Net income $ 44,698,500 Dividends 19,374,500 Retained earnings 25,324,000 25% 6 7 Tax rate 8 9 Sales 10 COGS 11 Other expenses 12 Depreciation 13 EBIT 14 Interest 15 Taxable income $ 550,424,000 397,185,000 65,778,000 17,963,000 $ 22,104,632 4.360% $ 69,498,000 9,900,000 $ 59,598,000 14.899,500 $ 44,698,500 16 Taxes $ $ $ 19,374,500 25,324,000 2019 2020 2019 2020 $ 9,580,100 17,032,300 15,382,000 987,900 42,982,300 Liabilities & Equity Current liabilities Accounts payable Accrued expenses Total current liabilities $ 38,133,900 $ 40,161,400 4,875,600 5,723,700 $ 43,009,500 $ 45,885,100 $ $ 136,674,000 $ 136,674,000 17 Net income 18 19 Dividends 20 Add to RE 21 22 Assets 23 Current assets 24 Cash and equivalents 25 Accounts receivable 26 Inventory 27 Other 28 Total current assets 29 30 Property, plant, & equipment 31 Less accumulated depreciation 32 Net PP&E 33 Intangible assets and others 34 Total fixed assets 35 36 37 38 39 40 Total assets 41 42 Growth rate 43 Minimum FA purchase 44 $ 364,255,000 $ 412,032,000 S (84,489,000) (102,452,000) S $ 279,766,000 $ 309,580,000 $ $ 6,095,000 $ 285,861,000 Long-term debt Total Long-term liabilities 507,032,000 (124,556,632) Stockholders' equity 382,475,368 Preferred stock Common stock Capital surplus Accumulated retained earnings Less treasury stock Total equity $ 1,773,000 26,730,000 10,620,000 120,728,800 (10,692,000) $ 149, 159,800 Total liabilities and Shareholders' Equity $ 328,843,300 $ 328,843,300 20% 95,000,000 Loan Payment Loan Payment $ 6,175,000.0 ($7,274,857.01) 1,099,857.0 S EAST COAST YACHTS 2020 Balance Sheet Current assets Current liabilities Cash and equivalents $ 10,107,000 Accounts payable $ 40,161,400 Accounts receivable 16,813.300 Accrued expenses 5.723,700 Inventory 18,135,700 Total current liabilities $ 45,855,100 Other 1,054,900 Total current assets $ 46,110.900 Fixed assets Long-term debt $ 152,374,000 Property, plant, and equipment $ 412.032,000 Total long-term liabilities $ 152,374,000 Less accumulated depreciation (102,452,000) Net property, plant, and equipment $309,580,000 Intangible assets and others 6,772,000 Stockholders' equity Total fixed assets $ 316,352,000 Preferred stock $ 1,773,000 Common stock 31,802.000 Capital surplus 27.348.000 Accumulated retained earnings 146.052,800 Less treasury stock (42,772,000) Total equity $ 164,203.800 Total assets $362,462,900 Total liabilities and shareholders' equity S 362.462.900 YACHT INDUSTRY RATIOS 0 Lower Quartile Median Upper Quartile Current ratio .86 1.51 1.97 Quick ratio .43 .75 1.01 Total asset turnover 1.10 1.27 1.46 Inventory turnover 12.18 14.38 16.43 Receivables turnover 10.25 17.65 22.43 Debt ratio .32 .56 .61 Debt-equity ratio .83 1.13 1.44 Equity multiplier 1.83 2.13 2.44 Interest coverage 5.72 8.21 10.83 Profit margin 5.02% 7.48% 9.05% Return on assets 7.05% 10.67% 14.16% Return on equity 14.06% 19.32% 26.41% 2016 iteration 1 2016 iteration 2 2016 iteration 3 Revenues Costs Interest Taxable income Taxes Net income Dividends Retained earnings CA CL Fixed assets Debt Equity 125% + 2/2 Total Total EAST COAST YACHTS 2020 Income Statement Sales $ 550,424,000 Cost of goods sold 397,185,000 Selling, general, and administrative 65,778,000 Depreciation 17,963,000 EBIT 69,498,000 Interest expense 9,900,000 EBT 59,598,000 Taxes (25%) 14,899,500 Net income $ 44,698,500 Dividends 19,374,500 Retained earnings 25,324,000 25% 6 7 Tax rate 8 9 Sales 10 COGS 11 Other expenses 12 Depreciation 13 EBIT 14 Interest 15 Taxable income $ 550,424,000 397,185,000 65,778,000 17,963,000 $ 22,104,632 4.360% $ 69,498,000 9,900,000 $ 59,598,000 14.899,500 $ 44,698,500 16 Taxes $ $ $ 19,374,500 25,324,000 2019 2020 2019 2020 $ 9,580,100 17,032,300 15,382,000 987,900 42,982,300 Liabilities & Equity Current liabilities Accounts payable Accrued expenses Total current liabilities $ 38,133,900 $ 40,161,400 4,875,600 5,723,700 $ 43,009,500 $ 45,885,100 $ $ 136,674,000 $ 136,674,000 17 Net income 18 19 Dividends 20 Add to RE 21 22 Assets 23 Current assets 24 Cash and equivalents 25 Accounts receivable 26 Inventory 27 Other 28 Total current assets 29 30 Property, plant, & equipment 31 Less accumulated depreciation 32 Net PP&E 33 Intangible assets and others 34 Total fixed assets 35 36 37 38 39 40 Total assets 41 42 Growth rate 43 Minimum FA purchase 44 $ 364,255,000 $ 412,032,000 S (84,489,000) (102,452,000) S $ 279,766,000 $ 309,580,000 $ $ 6,095,000 $ 285,861,000 Long-term debt Total Long-term liabilities 507,032,000 (124,556,632) Stockholders' equity 382,475,368 Preferred stock Common stock Capital surplus Accumulated retained earnings Less treasury stock Total equity $ 1,773,000 26,730,000 10,620,000 120,728,800 (10,692,000) $ 149, 159,800 Total liabilities and Shareholders' Equity $ 328,843,300 $ 328,843,300 20% 95,000,000 Loan Payment Loan Payment $ 6,175,000.0 ($7,274,857.01) 1,099,857.0 S EAST COAST YACHTS 2020 Balance Sheet Current assets Current liabilities Cash and equivalents $ 10,107,000 Accounts payable $ 40,161,400 Accounts receivable 16,813.300 Accrued expenses 5.723,700 Inventory 18,135,700 Total current liabilities $ 45,855,100 Other 1,054,900 Total current assets $ 46,110.900 Fixed assets Long-term debt $ 152,374,000 Property, plant, and equipment $ 412.032,000 Total long-term liabilities $ 152,374,000 Less accumulated depreciation (102,452,000) Net property, plant, and equipment $309,580,000 Intangible assets and others 6,772,000 Stockholders' equity Total fixed assets $ 316,352,000 Preferred stock $ 1,773,000 Common stock 31,802.000 Capital surplus 27.348.000 Accumulated retained earnings 146.052,800 Less treasury stock (42,772,000) Total equity $ 164,203.800 Total assets $362,462,900 Total liabilities and shareholders' equity S 362.462.900 YACHT INDUSTRY RATIOS 0 Lower Quartile Median Upper Quartile Current ratio .86 1.51 1.97 Quick ratio .43 .75 1.01 Total asset turnover 1.10 1.27 1.46 Inventory turnover 12.18 14.38 16.43 Receivables turnover 10.25 17.65 22.43 Debt ratio .32 .56 .61 Debt-equity ratio .83 1.13 1.44 Equity multiplier 1.83 2.13 2.44 Interest coverage 5.72 8.21 10.83 Profit margin 5.02% 7.48% 9.05% Return on assets 7.05% 10.67% 14.16% Return on equity 14.06% 19.32% 26.41%


