

Answered step by step
Verified Expert Solution
Question
1 Approved Answer
Calculate Free Cash Flow. Show NOPAT, NOWC, TOC, NIOC, and FCF. Display Performance Evaluation. Calculate/Show ROIC, OP, CR, MVA, and EVA. ASSETS 2019 $ 900.00
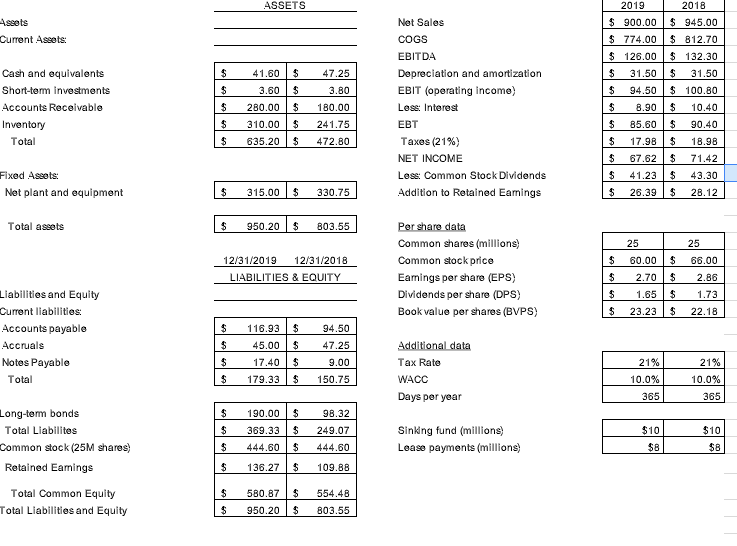
Calculate Free Cash Flow. Show NOPAT, NOWC, TOC, NIOC, and FCF.
Display Performance Evaluation. Calculate/Show ROIC, OP, CR, MVA, and EVA.
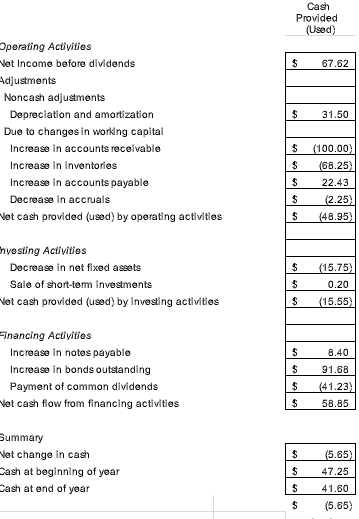
ASSETS 2019 $ 900.00 Assets Current Assets: $ $ 47.25 3.80 Cash and equivalents Short-term investments Accounts Receivable Inventory Total $ $ $ $ 41.60 3.60 280.00 310.00 | Net Sales COGS EBITDA Depreciation and amortization EBIT (operating income) Lese: Interest EBT Taxes (21%) NET INCOME Less: Common Stock Dividends Addition to retained Eamings $ $ 2018 $ 945.00 $ 812.70 $ 132.30 $ 31.50 $ 100.80 $ 10.40 $ 90.40 $ 18.98 $ 71.42 180.00 241.75 472.80 $ 774.00 $ 126.00 31.50 $ 94.50 $ 8.90 $ 85.60 $ 17.98 $ 67.62 $ 41.23 $ 26.39 $ 635.20 $ $ Fixed Assets: Net plant and equipment 43.30 28.12 $ 315.00 $ 330.75 $ Total assets $ 950.20 $ B03.55 25 60.00 $ 12/31/2019 12/31/2018 LIABILITIES & EQUITY Per sharo data Common shares (millions) Common stock price Eamings per share (EPS) Dividends per share (DPS) Book value per shares (BVPS) $ $ 25 66.00 2.86 $ $ 2.70 1.65 23.23 1.73 $ $ $ 22.18 $ Liabilities and Equity Current liabilities Accounts payable Accruals Notes Payable Total 94.50 47.25 $ $ 116.93 $ 45.00 $ 17.40 $ 179.33 $ 9.00 150.75 Additional data Tax Rate WACC Days per year 21% 10.0% $ 21% 10.0% 365 365 $ $ 190.00 369.33 $ $ Long-term bonds Total Liabilites Common stock (25M shares) Retained Eamings 98.32 249.07 444.60 Sinking fund (millions) Lease payments (millions $10 $8 $10 $8 $ 444.60 $ $ 136.27 $ 109.88 $ Total Common Equity Total Liabilities and Equity $ $ 580.87 950.20 554.48 B03.55 $ Cash Provided (Used) $ 67.62 $ 31.50 perating Activities Net Income before dividends Adjustments Noncash adjustments Depreciation and amortization Due to changes in working capital Increase in accounts receivable Increase in inventories Increase in accounts payable Decrease in accruals Net cash provided (used) by operating activities $ $ $ (100.00 (68.25) 22.43 (2.25) (48.95) $ $ $ nyosting Activities Decrease in net fixed assets Sale of short-term investments Net cash provided (used) by investing activities (15.75) 0.20 $ $ (15.55) $ 8.40 Financing Activities Increase in notes payable Increase in bonds outstanding Payment of common dividends Net cash flow from financing activities $ $ 91.68 (41.23) 58.85 $ Summary Net change in cash Cash at beginning of year Dash at end of year (5.65) 47.25 41.60 (5.65) ASSETS 2019 $ 900.00 Assets Current Assets: $ $ 47.25 3.80 Cash and equivalents Short-term investments Accounts Receivable Inventory Total $ $ $ $ 41.60 3.60 280.00 310.00 | Net Sales COGS EBITDA Depreciation and amortization EBIT (operating income) Lese: Interest EBT Taxes (21%) NET INCOME Less: Common Stock Dividends Addition to retained Eamings $ $ 2018 $ 945.00 $ 812.70 $ 132.30 $ 31.50 $ 100.80 $ 10.40 $ 90.40 $ 18.98 $ 71.42 180.00 241.75 472.80 $ 774.00 $ 126.00 31.50 $ 94.50 $ 8.90 $ 85.60 $ 17.98 $ 67.62 $ 41.23 $ 26.39 $ 635.20 $ $ Fixed Assets: Net plant and equipment 43.30 28.12 $ 315.00 $ 330.75 $ Total assets $ 950.20 $ B03.55 25 60.00 $ 12/31/2019 12/31/2018 LIABILITIES & EQUITY Per sharo data Common shares (millions) Common stock price Eamings per share (EPS) Dividends per share (DPS) Book value per shares (BVPS) $ $ 25 66.00 2.86 $ $ 2.70 1.65 23.23 1.73 $ $ $ 22.18 $ Liabilities and Equity Current liabilities Accounts payable Accruals Notes Payable Total 94.50 47.25 $ $ 116.93 $ 45.00 $ 17.40 $ 179.33 $ 9.00 150.75 Additional data Tax Rate WACC Days per year 21% 10.0% $ 21% 10.0% 365 365 $ $ 190.00 369.33 $ $ Long-term bonds Total Liabilites Common stock (25M shares) Retained Eamings 98.32 249.07 444.60 Sinking fund (millions) Lease payments (millions $10 $8 $10 $8 $ 444.60 $ $ 136.27 $ 109.88 $ Total Common Equity Total Liabilities and Equity $ $ 580.87 950.20 554.48 B03.55 $ Cash Provided (Used) $ 67.62 $ 31.50 perating Activities Net Income before dividends Adjustments Noncash adjustments Depreciation and amortization Due to changes in working capital Increase in accounts receivable Increase in inventories Increase in accounts payable Decrease in accruals Net cash provided (used) by operating activities $ $ $ (100.00 (68.25) 22.43 (2.25) (48.95) $ $ $ nyosting Activities Decrease in net fixed assets Sale of short-term investments Net cash provided (used) by investing activities (15.75) 0.20 $ $ (15.55) $ 8.40 Financing Activities Increase in notes payable Increase in bonds outstanding Payment of common dividends Net cash flow from financing activities $ $ 91.68 (41.23) 58.85 $ Summary Net change in cash Cash at beginning of year Dash at end of year (5.65) 47.25 41.60 (5.65)Step by Step Solution
There are 3 Steps involved in it
Step: 1

Get Instant Access to Expert-Tailored Solutions
See step-by-step solutions with expert insights and AI powered tools for academic success
Step: 2

Step: 3
Ace Your Homework with AI
Get the answers you need in no time with our AI-driven, step-by-step assistance
Get Started
Financing Large Projects Using Project Finance Techniques And Practices
Authors: Fouzul Khan, Robert Parra
1st Edition
9780131016347