Answered step by step
Verified Expert Solution
Question
1 Approved Answer
Calculate g1, g2, h1, and h2. Please include formulas (mathmatical and names of what is being used) 1/21/2021 90,067,000 1/01/2018 Liquidity Ratio 1/31/2020 61,806,000 9,465,000
Calculate g1, g2, h1, and h2. Please include formulas (mathmatical and names of what is being used) 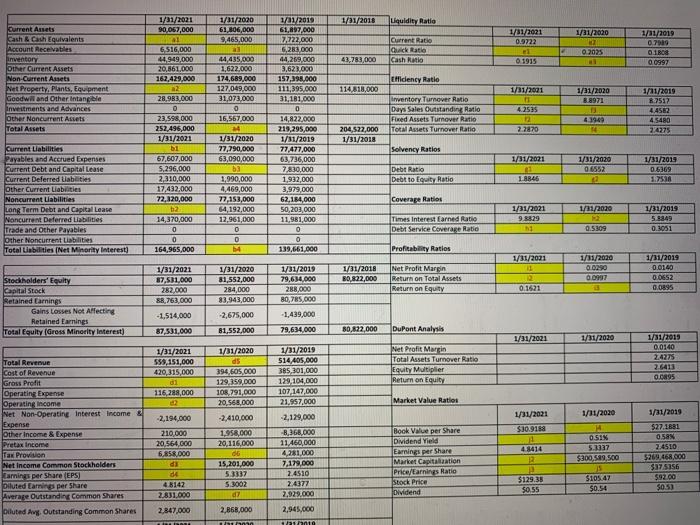
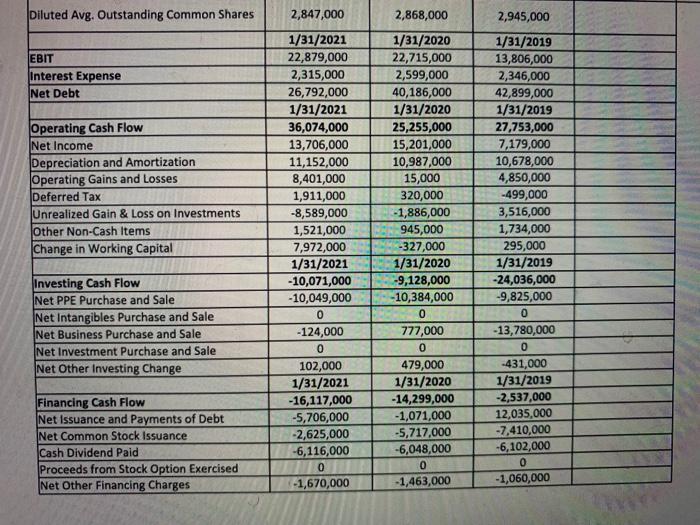
1/21/2021 90,067,000 1/01/2018 Liquidity Ratio 1/31/2020 61,806,000 9,465,000 1/21/2021 0.9722 1/21/2020 Current Ratio Quick Ratio Cash Ratio 0.2025 1/21/2019 0.799 0.1808 0.0997 43,783,000 0.1915 Current Assets Cash & Cach Equivalents Account Receivables inventory Other Current Assets Non-Current Assets Net Property Plants, Equipment Goodwi and Other intangible Investments and Advances Other Noncurrent Acrets Total Assets Efficiency Ratio 114,818,000 1/31/2001 1/31/2020 8.8971 inventory Turnover Ratio Days Sales Outstanding Ratio Fixed Assets Turnover Ratio Total Assets Turnover Ratio 4.2535 1/21/2019 R2552 4.4582 4.5480 2/4275 4.1949 54 204,522,000 1/31/2013 22870 1/01/2010 61,897.000 2.722.000 6,282.000 44.269,000 3,623.000 157,195.000 111,395.000 31,181,000 0 14,822.000 219,295,000 1/11/2019 77,477,000 63,736,000 7,830,000 1,932,000 3,979,000 62.184,000 50,203,000 11,981,000 0 0 139,661,000 6 516,000 44,949,000 20,861,000 162,429,000 22 28.983.000 0 23,598,000 252,496,000 1/31/2021 bi 67,607,000 5.296,000 2,310,000 17,432,000 72,120,000 2 14,370,000 0 0 164,965,000 44,435,000 1.622.000 174,689.000 127,049.000 31,073,000 0 16,567.000 4 1/31/2020 77,790,000 63,090,000 b3 1,990,000 4,469,000 77 153,000 54,192.000 12,961,000 0 D 54 Solvency Ratios 1/31/2021 1/31/2020 06552 Debt Ratio Debt to Equity Ratio Current Liabilities payables and Accrued Expenses Current Debt and Capital Lease Current Deferred Liabilities Other Current Liabilities Noncurrent abilities Long Term Debt and Capital Lease Noncurrent Deferred liabilities Trade and Other Pavables Other Noncurrent liabilities Total liabidities (Net Minority interest) 1/31/2013 0.6369 1.750 18846 Coverape Ratios 1/21/2020 1/31/2021 9.8529 Times interest Earned flatio Debt Service Coverage Ratio 1/31/2019 5.9849 0.3051 0.5309 Profitability Ratios 1/31/2021 1/31/2018 0,822,000 1/31/2010 0.0290 0.0007 1/31/2021 87,511.000 282,000 88.763,000 1/31/2020 81,552,000 284,000 83,943,000 Net Profit Margin Return on Total Assets Return on Equity 1/31/2019 0.0140 0.0652 0.0895 1/31/2019 79,634.000 288,000 80,785,000 -1,439,000 Stockholders' Equity Capital Stock Retained Earnings Gains Losses Not Affecting Retained Earnings Total Equity (Gross Minority Interest) 12 0.1621 -1,514,000 -2,675,000 81,552,000 87,531.000 79.634.000 80.822,000 DuPont Analysis 1/31/2021 1/31/2020 1/31/2021 558.151,000 420,315,000 d1 116,288,000 1/31/2013 0.0140 2.4275 2.6413 0.0895 1/31/2019 514,405,000 385,301.000 129,104,000 107,147,000 21.957.000 -2,129,000 Net Profit Martin Total Assets Turnover Ratio Equity Multiplier Return on Equity Market Value Ratio 1/31/2020 1/31/2019 Total Revenue Cost of Revenue Gross Profit Operating Expense Operating income Net Non-Operating Interest Income & Expense Other Income & Expense Pretax income Tax Provin Net Income Common Stockholders Earnings per Share (EPS) Diluted Earnings per Share Average Outstanding Common Shares Diluted Awy. Outstanding Common Shares 1/31/2021 $30.9188 1/31/2020 ds 294,605,000 129.359.000 108,791,000 20.568,000 -2.410.000 1.958.000 20,116,000 06 15,201,000 5.3337 53002 07 -2,194,000 210,000 20,564.000 6.858.000 ds de 48142 2.831.000 2,847,000 TTT 8,368,000 11,460,000 4,281,000 7,179,000 2.4510 2.4377 2.929.000 Book Value per Share Dividend Yield Earnings per Share Market Capitation Price/Earnings Ratio Stock Price Dividend 48414 2 P $129.35 $0.55 0.51% 5.3337 $300,529,500 js $10.47 $0.54 $27. 1681 058N 2.4510 $269,468.000 $375156 $9200 $0.50 2,868,000 2.945,000 NA ant Diluted Avg. Outstanding Common Shares 2,847,000 2,945,000 EBIT Interest Expense Net Debt Operating Cash Flow Net Income Depreciation and Amortization Operating Gains and Losses Deferred Tax Unrealized Gain & Loss on Investments Other Non-Cash Items Change in Working Capital 1/31/2021 22,879,000 2,315,000 26,792,000 1/31/2021 36,074,000 13,706,000 11,152,000 8,401,000 1,911,000 -8,589,000 1,521,000 7,972,000 1/31/2021 -10,071,000 -10,049,000 0 -124,000 0 102,000 1/31/2021 -16,117,000 -5,706,000 -2,625,000 -6,116,000 0 -1,670,000 2,868,000 1/31/2020 22,715,000 2,599,000 40,186,000 1/31/2020 25,255,000 15,201,000 10,987,000 15,000 320,000 -1,886,000 945,000 -327,000 1/31/2020 -9,128,000 -10,384,000 0 777,000 0 479,000 1/31/2020 -14,299,000 -1,071,000 -5,717,000 -6,048,000 0 -1,463,000 1/31/2019 13,806,000 2,346,000 42,899,000 1/31/2019 27,753,000 7,179,000 10,678,000 4,850,000 -499,000 3,516,000 1,734,000 295,000 1/31/2019 -24,036,000 -9,825,000 0 - 13,780,000 0 -431,000 1/31/2019 -2,537,000 12,035,000 -7,410,000 -6,102,000 0 -1,060,000 Investing Cash Flow Net PPE Purchase and Sale Net Intangibles Purchase and Sale Net Business Purchase and Sale Net Investment Purchase and Sale Net Other Investing Change Financing Cash Flow Net Issuance and Payments of Debt Net Common Stock Issuance Cash Dividend Paid Proceeds from Stock Option Exercised Net Other Financing Charges 1/21/2021 90,067,000 1/01/2018 Liquidity Ratio 1/31/2020 61,806,000 9,465,000 1/21/2021 0.9722 1/21/2020 Current Ratio Quick Ratio Cash Ratio 0.2025 1/21/2019 0.799 0.1808 0.0997 43,783,000 0.1915 Current Assets Cash & Cach Equivalents Account Receivables inventory Other Current Assets Non-Current Assets Net Property Plants, Equipment Goodwi and Other intangible Investments and Advances Other Noncurrent Acrets Total Assets Efficiency Ratio 114,818,000 1/31/2001 1/31/2020 8.8971 inventory Turnover Ratio Days Sales Outstanding Ratio Fixed Assets Turnover Ratio Total Assets Turnover Ratio 4.2535 1/21/2019 R2552 4.4582 4.5480 2/4275 4.1949 54 204,522,000 1/31/2013 22870 1/01/2010 61,897.000 2.722.000 6,282.000 44.269,000 3,623.000 157,195.000 111,395.000 31,181,000 0 14,822.000 219,295,000 1/11/2019 77,477,000 63,736,000 7,830,000 1,932,000 3,979,000 62.184,000 50,203,000 11,981,000 0 0 139,661,000 6 516,000 44,949,000 20,861,000 162,429,000 22 28.983.000 0 23,598,000 252,496,000 1/31/2021 bi 67,607,000 5.296,000 2,310,000 17,432,000 72,120,000 2 14,370,000 0 0 164,965,000 44,435,000 1.622.000 174,689.000 127,049.000 31,073,000 0 16,567.000 4 1/31/2020 77,790,000 63,090,000 b3 1,990,000 4,469,000 77 153,000 54,192.000 12,961,000 0 D 54 Solvency Ratios 1/31/2021 1/31/2020 06552 Debt Ratio Debt to Equity Ratio Current Liabilities payables and Accrued Expenses Current Debt and Capital Lease Current Deferred Liabilities Other Current Liabilities Noncurrent abilities Long Term Debt and Capital Lease Noncurrent Deferred liabilities Trade and Other Pavables Other Noncurrent liabilities Total liabidities (Net Minority interest) 1/31/2013 0.6369 1.750 18846 Coverape Ratios 1/21/2020 1/31/2021 9.8529 Times interest Earned flatio Debt Service Coverage Ratio 1/31/2019 5.9849 0.3051 0.5309 Profitability Ratios 1/31/2021 1/31/2018 0,822,000 1/31/2010 0.0290 0.0007 1/31/2021 87,511.000 282,000 88.763,000 1/31/2020 81,552,000 284,000 83,943,000 Net Profit Margin Return on Total Assets Return on Equity 1/31/2019 0.0140 0.0652 0.0895 1/31/2019 79,634.000 288,000 80,785,000 -1,439,000 Stockholders' Equity Capital Stock Retained Earnings Gains Losses Not Affecting Retained Earnings Total Equity (Gross Minority Interest) 12 0.1621 -1,514,000 -2,675,000 81,552,000 87,531.000 79.634.000 80.822,000 DuPont Analysis 1/31/2021 1/31/2020 1/31/2021 558.151,000 420,315,000 d1 116,288,000 1/31/2013 0.0140 2.4275 2.6413 0.0895 1/31/2019 514,405,000 385,301.000 129,104,000 107,147,000 21.957.000 -2,129,000 Net Profit Martin Total Assets Turnover Ratio Equity Multiplier Return on Equity Market Value Ratio 1/31/2020 1/31/2019 Total Revenue Cost of Revenue Gross Profit Operating Expense Operating income Net Non-Operating Interest Income & Expense Other Income & Expense Pretax income Tax Provin Net Income Common Stockholders Earnings per Share (EPS) Diluted Earnings per Share Average Outstanding Common Shares Diluted Awy. Outstanding Common Shares 1/31/2021 $30.9188 1/31/2020 ds 294,605,000 129.359.000 108,791,000 20.568,000 -2.410.000 1.958.000 20,116,000 06 15,201,000 5.3337 53002 07 -2,194,000 210,000 20,564.000 6.858.000 ds de 48142 2.831.000 2,847,000 TTT 8,368,000 11,460,000 4,281,000 7,179,000 2.4510 2.4377 2.929.000 Book Value per Share Dividend Yield Earnings per Share Market Capitation Price/Earnings Ratio Stock Price Dividend 48414 2 P $129.35 $0.55 0.51% 5.3337 $300,529,500 js $10.47 $0.54 $27. 1681 058N 2.4510 $269,468.000 $375156 $9200 $0.50 2,868,000 2.945,000 NA ant Diluted Avg. Outstanding Common Shares 2,847,000 2,945,000 EBIT Interest Expense Net Debt Operating Cash Flow Net Income Depreciation and Amortization Operating Gains and Losses Deferred Tax Unrealized Gain & Loss on Investments Other Non-Cash Items Change in Working Capital 1/31/2021 22,879,000 2,315,000 26,792,000 1/31/2021 36,074,000 13,706,000 11,152,000 8,401,000 1,911,000 -8,589,000 1,521,000 7,972,000 1/31/2021 -10,071,000 -10,049,000 0 -124,000 0 102,000 1/31/2021 -16,117,000 -5,706,000 -2,625,000 -6,116,000 0 -1,670,000 2,868,000 1/31/2020 22,715,000 2,599,000 40,186,000 1/31/2020 25,255,000 15,201,000 10,987,000 15,000 320,000 -1,886,000 945,000 -327,000 1/31/2020 -9,128,000 -10,384,000 0 777,000 0 479,000 1/31/2020 -14,299,000 -1,071,000 -5,717,000 -6,048,000 0 -1,463,000 1/31/2019 13,806,000 2,346,000 42,899,000 1/31/2019 27,753,000 7,179,000 10,678,000 4,850,000 -499,000 3,516,000 1,734,000 295,000 1/31/2019 -24,036,000 -9,825,000 0 - 13,780,000 0 -431,000 1/31/2019 -2,537,000 12,035,000 -7,410,000 -6,102,000 0 -1,060,000 Investing Cash Flow Net PPE Purchase and Sale Net Intangibles Purchase and Sale Net Business Purchase and Sale Net Investment Purchase and Sale Net Other Investing Change Financing Cash Flow Net Issuance and Payments of Debt Net Common Stock Issuance Cash Dividend Paid Proceeds from Stock Option Exercised Net Other Financing Charges Step by Step Solution
There are 3 Steps involved in it
Step: 1

Get Instant Access to Expert-Tailored Solutions
See step-by-step solutions with expert insights and AI powered tools for academic success
Step: 2

Step: 3
Ace Your Homework with AI
Get the answers you need in no time with our AI-driven, step-by-step assistance
Get Started