

Question
Calculate how much an investor would have earned if he or she had invested $1 in the US (S&P 500), the Developed ex-US (EAFE), and
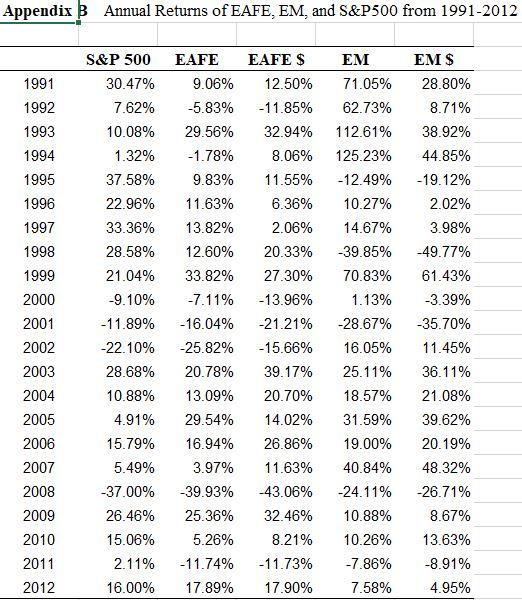
Calculate how much an investor would have earned if he or she had invested $1 in the US (S&P 500), the Developed ex-US (EAFE), and the Emerging Market (EM) indexes in both local currency and US dollars from 1991 to 2012.
Appendix Annual Returns of EAFE, EM, and S&P500 from 1991-2012 1991 1992 1993 1994 1995 1996 1997 1998 1999 2000 2001 2002 2003 2004 2005 2006 2007 2008 2009 2010 2011 2012 S&P 500 30.47% 7.62% 10.08% 1.32% 37.58% 22.96% 33.36% 28.58% 21.04% -9.10% -11.89% -22.10% 28.68% 10.88% 4.91% 15.79% 5.49% -37.00% 26.46% 15.06% 2.11% 16.00% EAFE 9.06% -5.83% 29.56% -1.78% 9.83% 11.63% 13.82% 12.60% 33.82% -7.11% -16.04% -25.82% 20.78% 13.09% 29.54% 16.94% 3.97% -39.93% 25.36% 5.26% -11.74% EAFE $ 12.50% -11.85% 32.94% 8.06% 11.55% 6.36% 2.06% 20.33% 27.30% -13.96% -21.21% -15.66% 39.17% 20.70% 14.02% 26.86% 11.63% -43.06% 32.46% 8.21% EM 71.05% 62.73% 112.61% 125.23% -12.49% 10.27% 14.67% 39.85% 70.83% 1.13% -28.67% 16.05% 25.11% 18.57% 31.59% 19.00% 40.84% -24.11% 10.88% 10.26% -7.86% 7.58% EM $ 28.80% 8.71% 38.92% 44.85% -19.12% 2.02% 3.98% -49.77% 61.43% -3.39% -35.70% 11.45% 36.11% 21.08% 39.62% 20.19% 48.32% -26.71% 8.67% 13.63% -8.91% 4.95% -11.73% 17.89% 17.90%Step by Step Solution
There are 3 Steps involved in it
Step: 1

Get Instant Access to Expert-Tailored Solutions
See step-by-step solutions with expert insights and AI powered tools for academic success
Step: 2

Step: 3
Ace Your Homework with AI
Get the answers you need in no time with our AI-driven, step-by-step assistance
Get Started
Investing For Women Smart Strategies To Start Investing Now With Confidence Low Risk And Minimal Effort
Authors: Mike Hartley ,Hannah Rosenstein
1st Edition
979-8393237202