Answered step by step
Verified Expert Solution
Question
1 Approved Answer
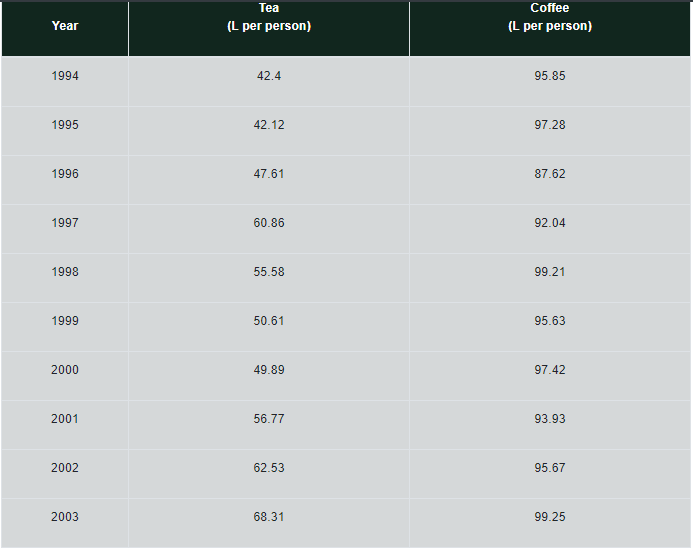
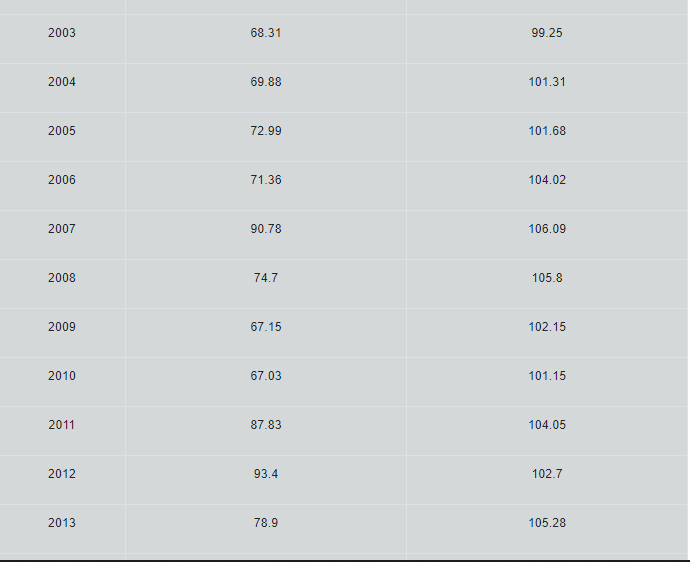
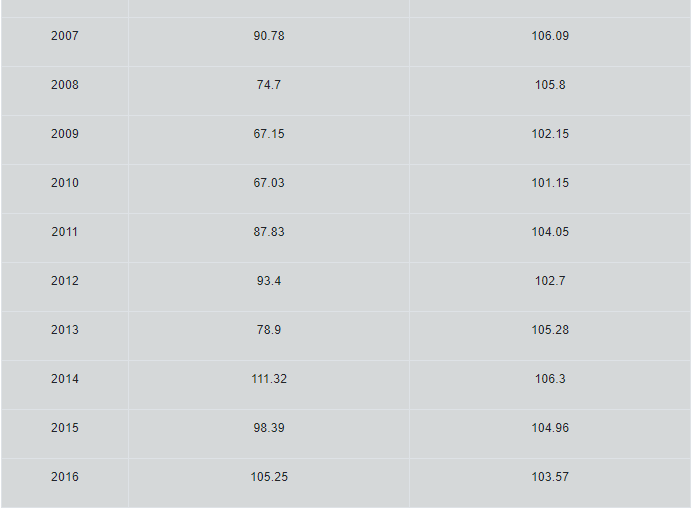
Calculate measures of central tendency and spread for coffee and tea. Create histograms and box-plots for both coffee and tea, displaying the number of years
- Calculate measures of central tendency and spread for coffee and tea.
- Create histograms and box-plots for both coffee and tea, displaying the number of years in each interval of consumption in L/person).
- Describe the distribution type for each based on the above graphs.
- Create scatter plots for Coffee vs. Year and Tea vs. Year and Coffee vs. Tea.
- Record the lines of best fitand correlation coefficient for each of the 3 scatter plots.
- Describe the correlation type for each of the above 3 scatter plots.


Step by Step Solution
There are 3 Steps involved in it
Step: 1

Get Instant Access to Expert-Tailored Solutions
See step-by-step solutions with expert insights and AI powered tools for academic success
Step: 2

Step: 3

Ace Your Homework with AI
Get the answers you need in no time with our AI-driven, step-by-step assistance
Get Started


