- Calculate Nike, Inc.s working capital on May 31, 2015 and 2014
- Calculate Nike, Inc.s Current Ratio on May 31, 2015 and 2014.
-
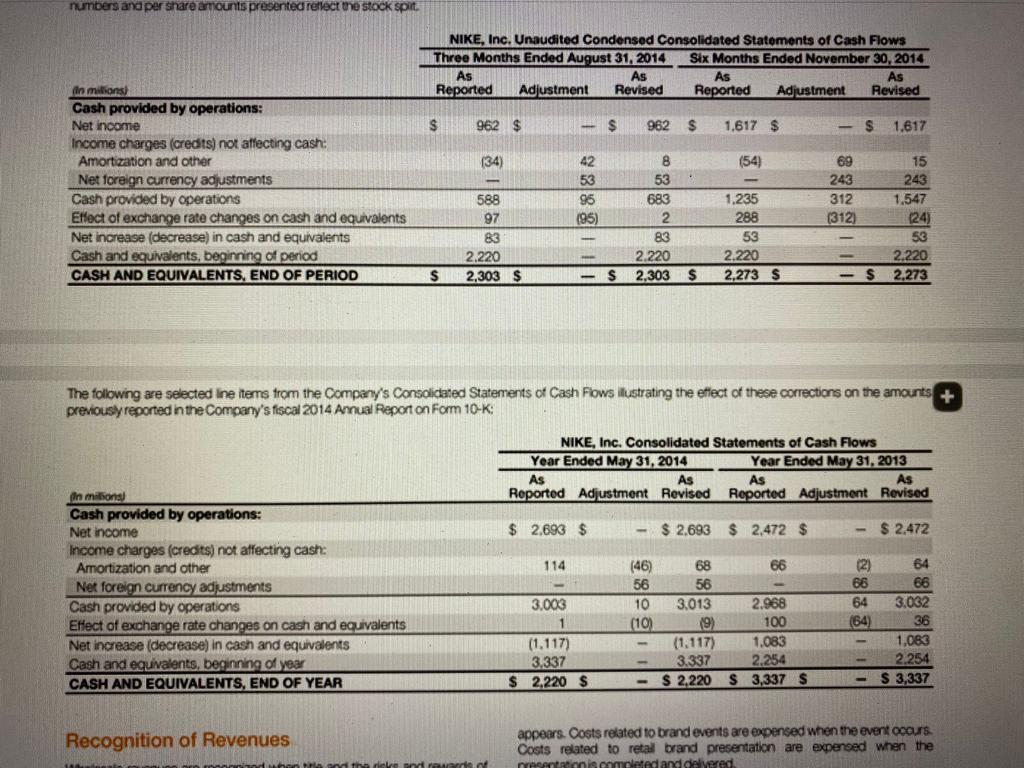
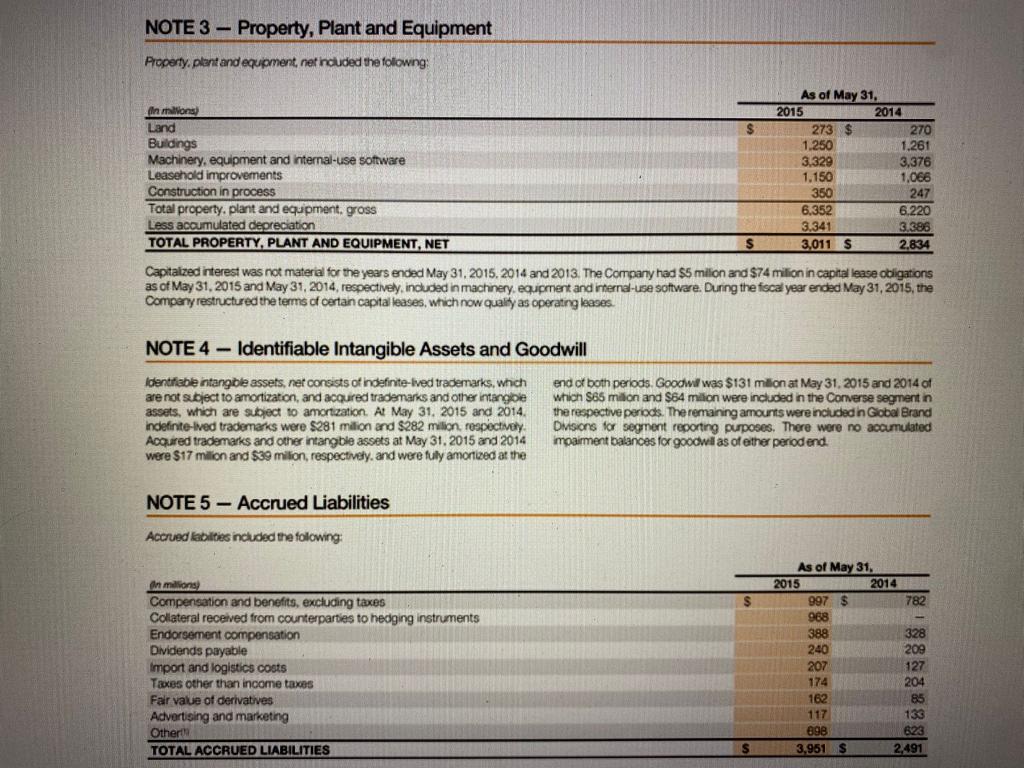
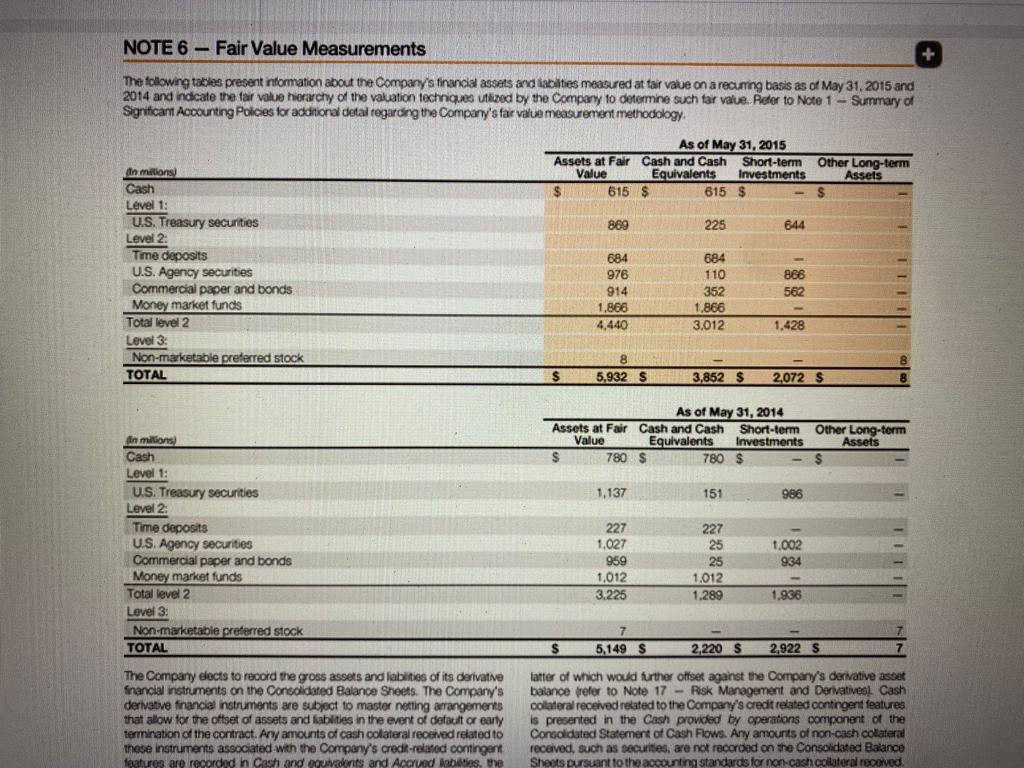
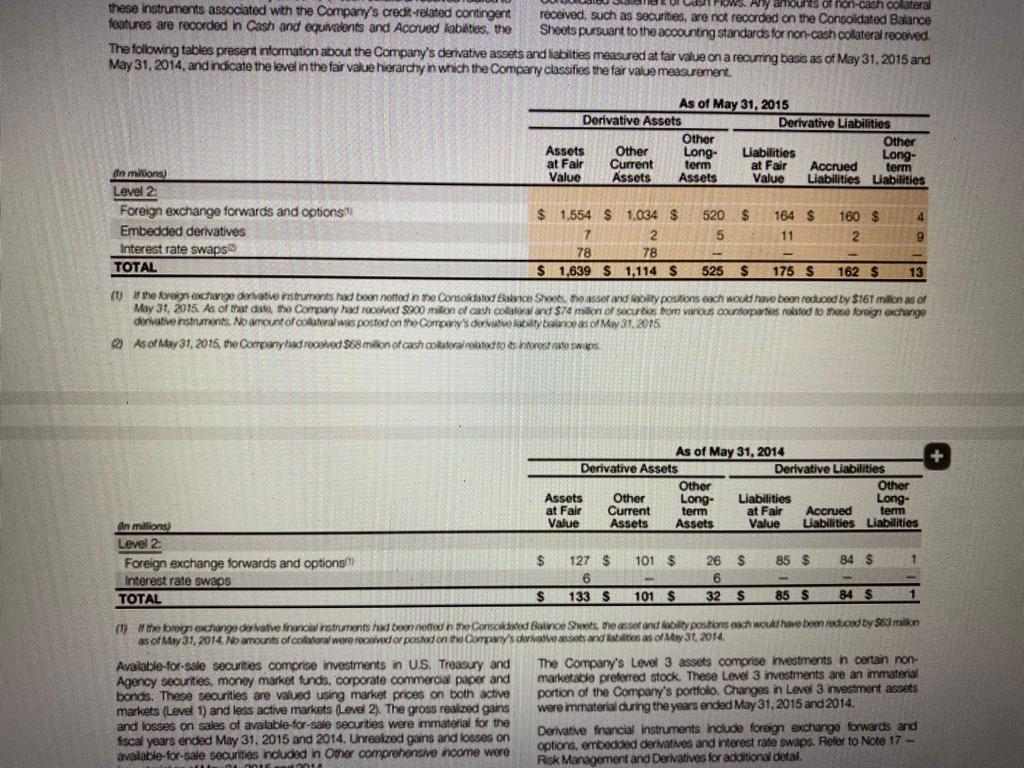
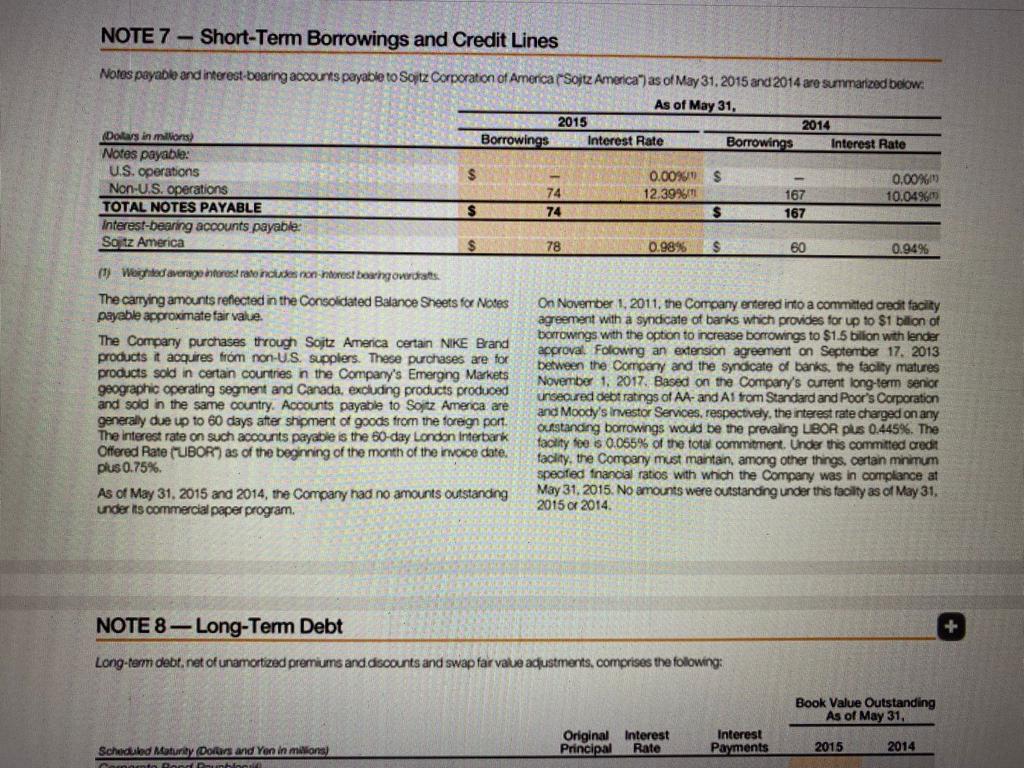
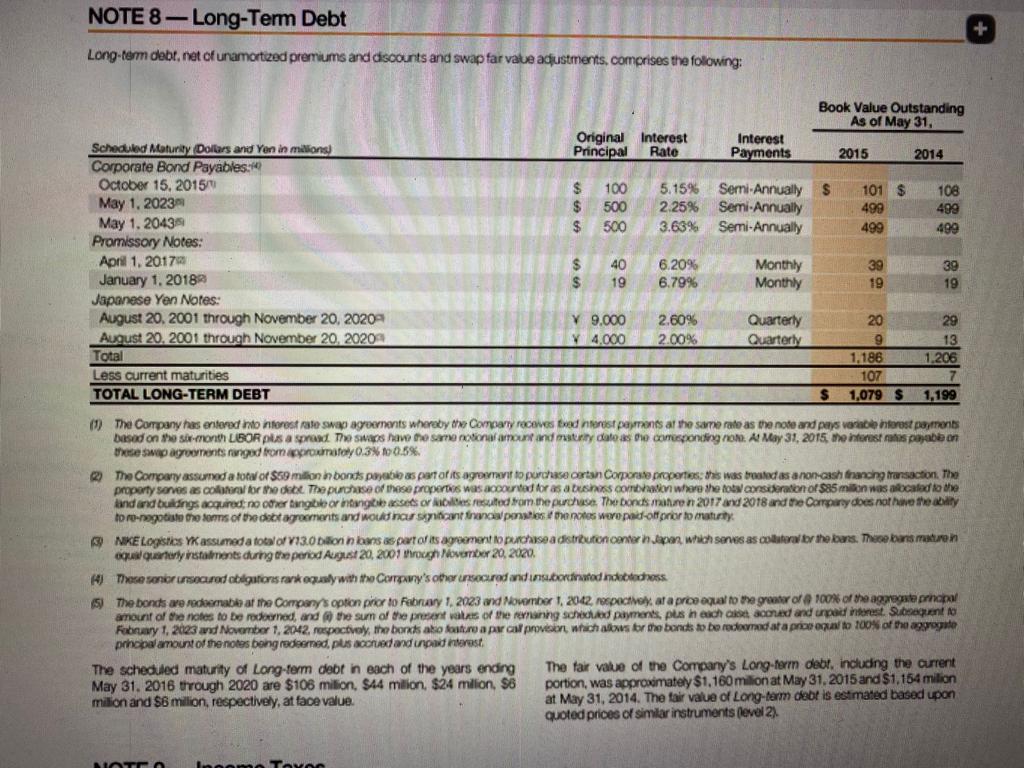
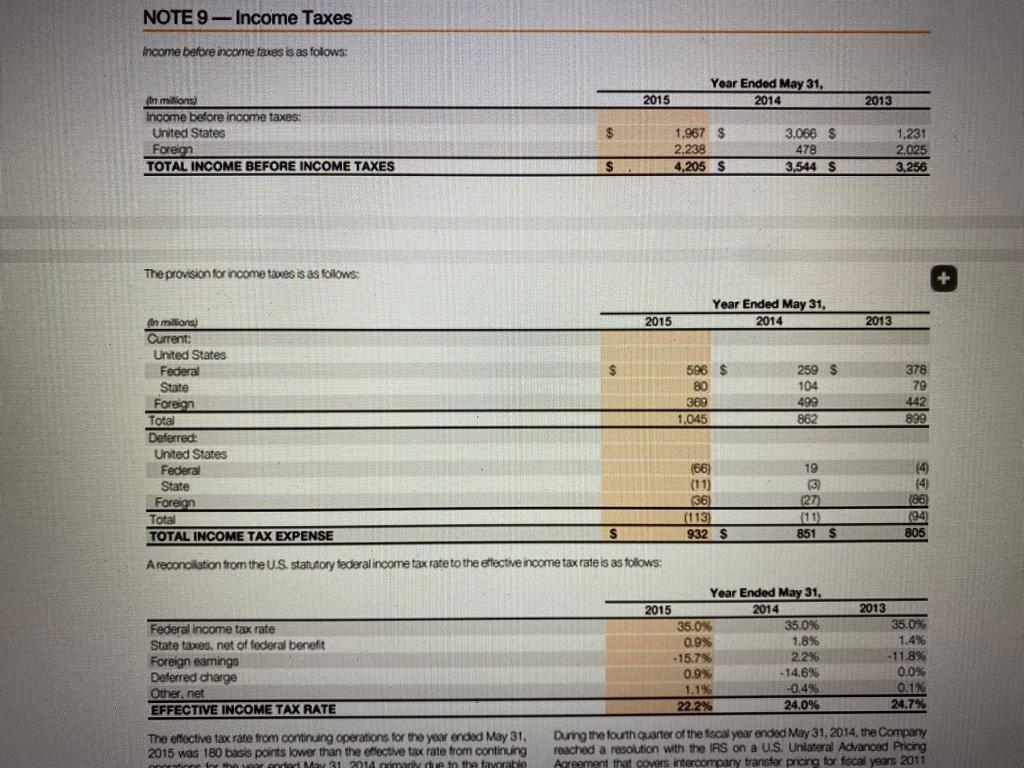
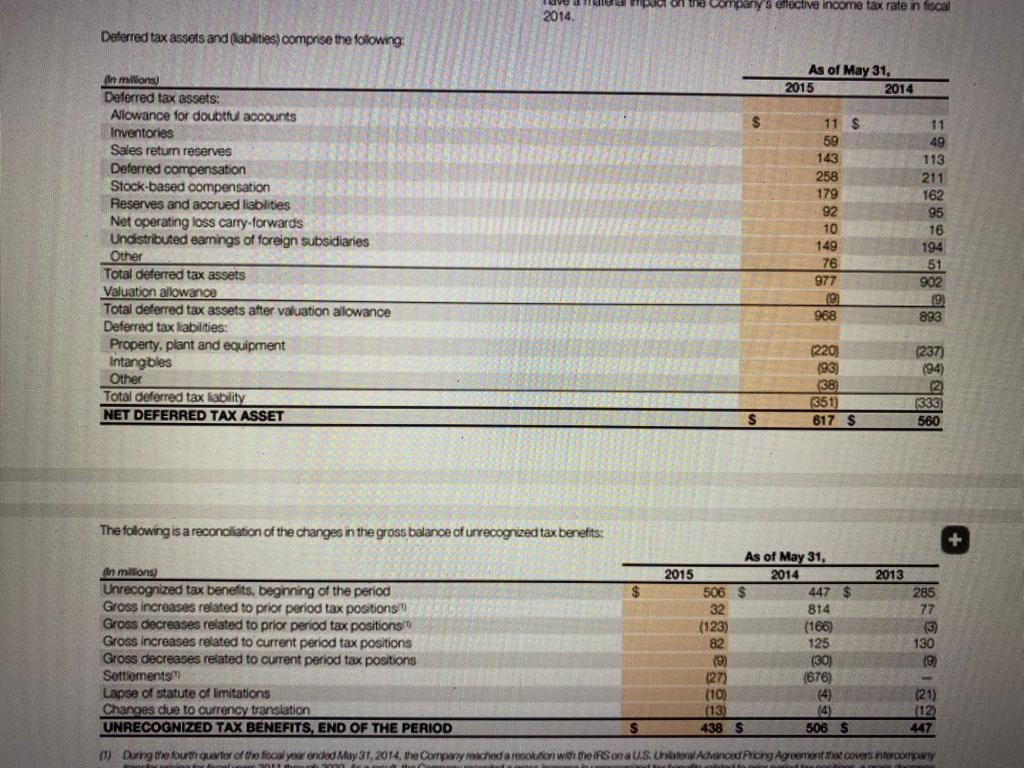
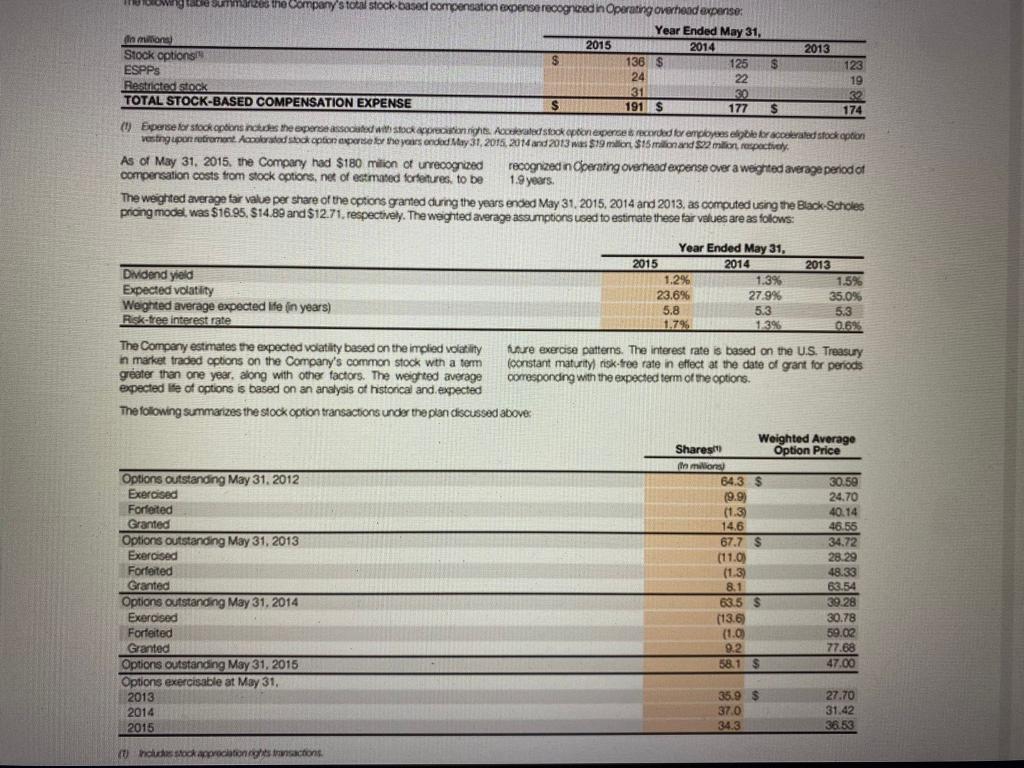
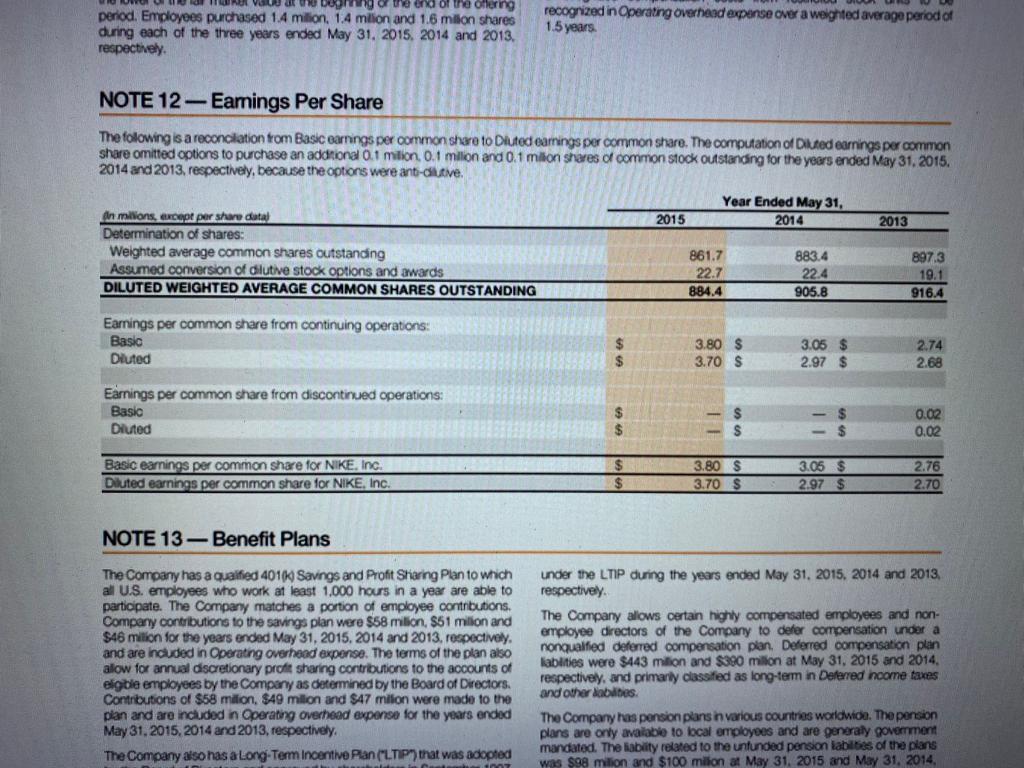
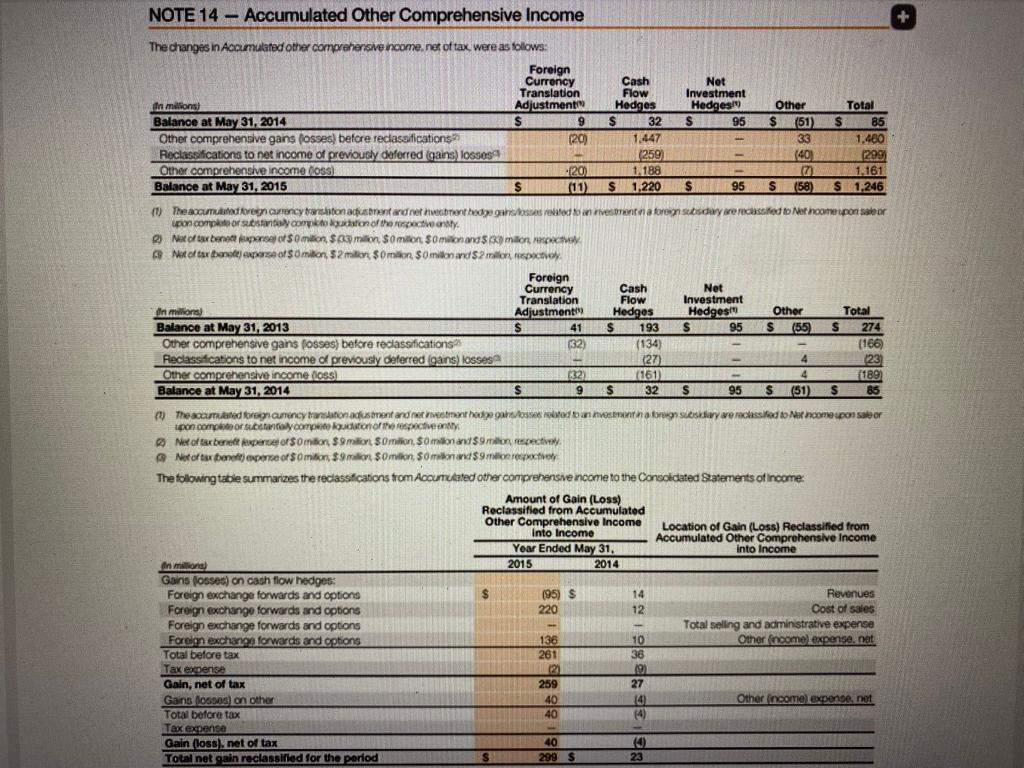
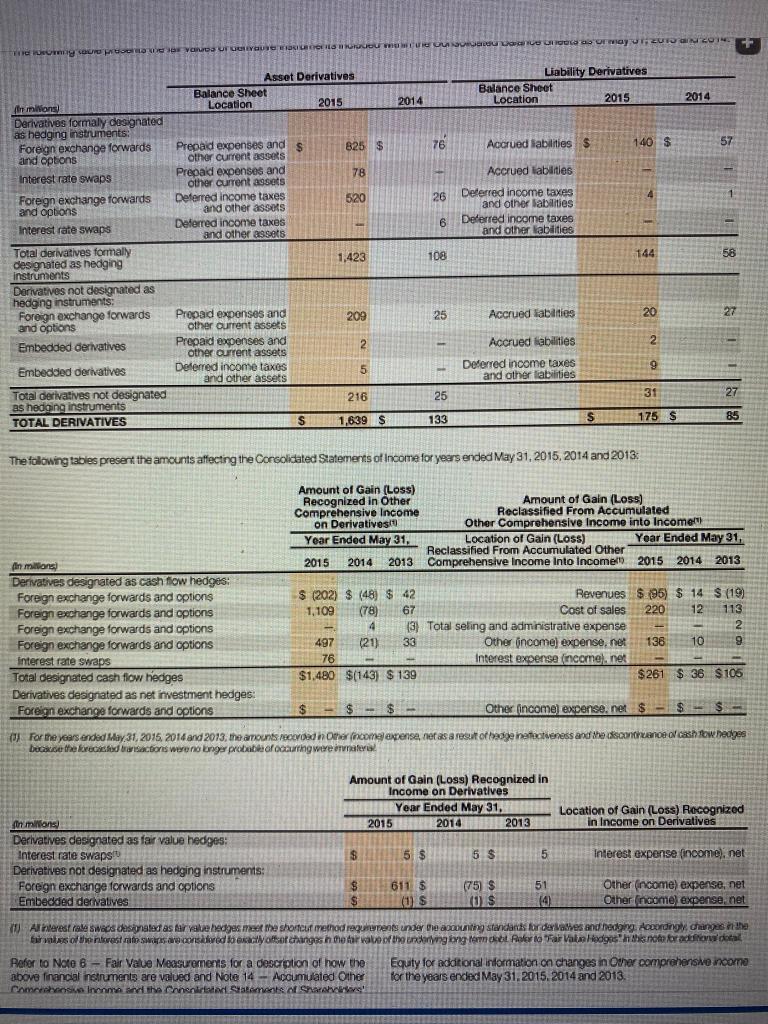
numbers and per share amounts presented reflect the stock split NIKE, Inc. Unaudited Condensed Consolidated Statements of Cash Flows Three Months Ended August 31, 2014 Six Months Ended November 30, 2014 As As As As Reported Adjustment Revised Reported Adjustment Revised $ 962 $ -- $ 962 $ 1,617 $ - S 1.617 (34) (54) In milions) Cash provided by operations: Net Income Income charges (credits) not affecting cash: Amortization and other Net foreign currency adjustments Cash provided by operations Elect of exchange rate changes on cash and equivalents Net increase (decrease) in cash and equivalents Cash and equivalents, beginning of period CASH AND EQUIVALENTS, END OF PERIOD 42 53 96 (95) 8 53 683 2 83 2.220 2,303 69 243 312 (312) 588 97 83 2.220 2,303 $ 15 243 1,547 (24) 53 2.220 2,273 1.235 288 53 2.220 2,273 $ - $ - S $ - $ The following are selected line items from the Company's Consolidated Statements of Cash Flows ilustrating the effect of these corrections on the amounts previously reported in the Company's fiscal 2014 Annual Report on Form 10-K; + NIKE, Inc. Consolidated Statements of Cash Flows Year Ended May 31, 2014 Year Ended May 31, 2013 As As As As Reported Adjustment Revised Reported Adjustment Revised $ 2,693 $ - $ 2,693 $ 2,472 $ $ 2,472 114 66 fin millions Cash provided by operations: Net income Income charges (credits) not affecting cash: Ammortization and other Net foreign currency adjustments Cash provided by operations Effect of exchange rate changes on cash and equivalents Net increase (decrease) in cash and equivalents Cash and equivalents, beginning of year CASH AND EQUIVALENTS, END OF YEAR (46) 56 10 (10) 3.003 1 (1.117) 3,337 $ 2.220 S 68 56 3,013 (9) (1.117) 3.337 $ 2,220 2.968 100 1.083 2.254 $ 3,337 $ (2) 64 66 66 64 3.032 (64) 36 1,083 2.254 - S 3,337 Recognition of Revenues appears. Costs related to brand events are expensed when the event occurs. Costs related to retail brand presentation are expensed when the presentationis completed and delivered non tamitha risken moet NOTE 3 - Property, Plant and Equipment Property, plant and equipment, net incuded the folowng: 2015 1,066 As of May 31. din millions 2014 Land 273 $ 270 Buildings 1.250 1.261 Machinery, equipment and internal-use software 3,329 3,376 Leasehold improvements 1.150 Construction in process 350 247 Total property, plant and equipment, gross 6,352 6.220 Less accumulated depreciation 3.341 3.386 TOTAL PROPERTY, PLANT AND EQUIPMENT, NET $ 3.011 S 2.834 Capitalized interest was not material for the years ended May 31, 2015, 2014 and 2013. The Company had $5 milion and $74 milion in capital lease obligations as of May 31, 2015 and May 31, 2014, respectively, induded in machinery, equipment and internal-use software. During the fiscal year ended May 31, 2015, the Company restructured the terms of certain capital eases, which now quality as operating leases NOTE 4 - Identifiable Intangible Assets and Goodwill Identifiable intangible assets, net consists of indefinite-ived trademarks, whch are not subject to amortization, and acquired trademarks and other intangible assets, which are subject to amortization. At May 31, 2015 and 2014. indefinite-ived trademarks were $281 milion and $282 milion, respectively Acquired trademarks and other intang ble assets at May 31, 2015 and 2014 were $17 million and $39 million, respectively and were fully amortized at the end of both periods. Goodwill was $131 million at May 31, 2015 and 2014 of which $65 million and $64 million were included in the Converse segment in the respective periods. The remaining amounts were included in Global Brand Divisions for segment reporting purposes. There were no accumulated impairment balances for goodwl as of either period end NOTE 5 - Accrued Liabilities Accrued abilities included the following: $ an millions) Compensation and benefits, excluding taxes Collateral received from counterparties to hedging instruments Endorsement compensation Dividends payable Import and logistics costs Taxes other than income taxes Far value of derivatives Advertising and marketing Others TOTAL ACCRUED LIABILITIES As of May 31, 2015 2014 997 $ 782 968 388 328 240 209 207 127 174 204 162 85 117 139 898 623 3.951 S 2.491 S NOTE 6 - Fair Value Measurements The following tables present information about the Company's financial assets and abilities measured at tair value on a recurring basis as of May 31, 2015 and 2014 and indicate the fair value hierarchy of the valuation techniques utilized by the Company to determine such tar value. Refer to Note 1 - Summary of Significant Accounting Policies for additional detail regarding the Company's far value measurement methodology. As of May 31, 2015 Assets at Fair Cash and Cash Short-term Value Equivalents Investments $ 615 $ Other Long-term Assets 615 $ 869 225 644 an millions Cash Level 1: U.S. Treasury securities Level 2 Time deposits U.S. Agency securities Commercial paper and bonds Money market funds Total level 2 Level 3: Non-marketable preferred stock TOTAL 684 976 914 1,866 4,440 684 110 352 1.866 3.012 886 562 1,428 8 5.932 $ $ 3,852 $ 2,072 S As of May 31, 2014 Assets at Fair Cash and Cash Short-term Value Equivalents Investments 780$ 780 $ Other Long-term Assets 1,137 151 988 An milions Cash Level 1: U.S. Treasury securities Level 2: Time deposits U.S. Agency securities Commercial paper and bonds Money market funds Total level 2 Level 3: Non-marketable preferred stock TOTAL 227 1,027 959 1,012 3.225 227 25 25 1.012 1.289 1.002 934 1.936 7 5,149 $ $ 2,220 S 2,922 S The Company elects to record the gross assets and liabities of its derivative financial instruments on the Consolidated Balance Sheets. The Company's derivative financial instruments are subject to master netting arrangements that allow for the oftset of assets and kablities in the event of default or early termination of the contract. Any amounts of cash colateral received related to these instruments associated with the Company's crecie-related contingent features are recorded in Cash and equivalents and Accrued labies, the latter which would further offset against the Company's derivative asset balance refer to Note 17 - Risk Management and Derivatives). Cash collateral received related to the Company's credit related contingent features is presented in the Cash provided by operations component of the Consolidated Statement of Cash Flows. Any amounts of non-cash colateral received, such as securities, are not recorded on the Consolidated Balance Sheets pursuant to the accounting standards for non-cash collateral recorved dows. Aty amounts of non-cash collateral these instruments associated with the Company's credit-related contingent received, such as securities, are not recorded on the Consoidated Balance features are recorded in Cash and equivalents and Accrued labikties the Shoots pursuant to the accounting standards fornon-cash collateral received The following tables present information about the Company's derivative assets and liabilties measured at far value on a recurring basis as of May 31, 2015 and May 31, 2014, and indicate the level in the fair value Hierarchy in which the Company classifies the far value measurement. As of May 31, 2015 Derivative Assets Derivative Liabilities Other Other Assets Other Liabilities Long- at Fair Current term at Fair Accrued term Value Assets Assets Value Liabilities Labilities Long- de millions Level 2: Foreign exchange forwards and options Embedded derivatives Interest rate swaps TOTAL 4 520 $ 5 5 164 $ 11 $ 1.554 S 1,034 $ 7 2 78 78 $ 1,639 S 1,114 S 160 $ 2. 9 525 $ 175 s 162 s 13 it the foreign exchange debate instruments had been notted in the Corso do Banco Shoes, the assor and by positions each would have been reduced by $161 million as of May 31, 2015 As of War at the Company had received 8900 milion of ash color $74 milion of sources from various autoparties rated to the foreign exchange derivative instruments. No amount of codawa/was posted on the company's devotos of May 31, 2015 As of May 31, 2015, the Company had received $68 milionofakchotterelated to enterest rate was As of May 31, 2014 Derivative Assets Derivative Liabilities Other Other Assets Other Long- Liabilities Long- at Fair Current term at Fair Accrued term Value Assets Assets Value Liabilities Liabilities eln millions) Level 2 Foreign exchange forwards and options) Interest rate swaps TOTAL $ 101 $ 85 $ 84 $ 1 127 $ 6 133 $ 26 $ 6 32 $ $ 101 S 85 S 84 S 1 We troixchigo de motive from struments had been retted in the Conske Bano Sheets, the asset and ability postions och woh boondood by 883 min as of My 31, 2014. Nanents of colore recovedor posed on the Company's divavessat and is as of My 31, 2014 Available for sale securities comprise investments in U.S. Treasury and The Company's Level 3 assets comprise investments in certain non- Agency securities, money market funds, corporate commercial paper and marketable preferred stock. These Level 3 investments are an immaterial bonds. These securities are valued using market prices on both active portion of the Company's portfolio. Changes in Level 3 investment assets markets (Level 1) and less active markets (Level 2). The gross realized gains were immaterial during the years ended May 31, 2015 and 2014, and losses on sales of avalable-for-sale securties were immaterial for the fiscal years ended May 31, 2015 and 2014. Unrealzed gains and losses on Derivative fnancial Instruments include foreign exchange forwards and available for sale securities included in other comprehensive income were options, embedoed derivatives and interest rate swaps. Refer to Note 17 - Risk Management and Derivatives for additional detal NOTE 7 - Short-Term Borrowings and Credit Lines Notes payable and interest-bearing accounts payable to Soitz Corporation of America Sojtz America) as of May 31, 2015 and 2014 are summarized below: As of May 31, 2015 2014 Dotasin millions Borrowings Interest Rate Borrowings Interest Rate Notes payable: U.S. operations $ 0.00% $ 0.00%! Non-U.S. operations 74 12.39% 167 10.049615 TOTAL NOTES PAYABLE $ 74 $ 167 Interest-bearing accounts payable: So tz America $ 78 0.98% $ 60 0.94% (1) Weighted average interest ratonces non torst boringowdats The carrying amounts reflected in the Consolidated Balance Sheets for Notes On November 1, 2011, the Company entered into a committed credit facility payable approximate fair value. agreement with a syndicate of banks which provides for up to $1 billion of The Company purchases through Sojtz America certain NIKE Brand borrowings with the option to increase borrowings to $1.5 billion with lender products it acquires from non-U.S. supplers. These purchases are for approval . Folowing an extension agreement on September 17, 2013 products sold in certain countries n the Company's Emerging Markets between the Company and the syndicate of banks, the facity matures November 1, 2017. Based on the Company's current long-term senior geographic operating segment and Canada, excluding products produced unsecured debt ratings of AA- and Al trom Standard and Poor's Corporation and sold in the same country. Accounts payable to Sojtz America are and Moody's Investor Services, respectively, the interest rate charged on any generally due up to 60 days after shipment of goods from the foreign port. The interest rate on such accounts payable is the 50-day London Interbank outstanding borrowings would be the prevailing LBOR pus 0.445%. The WS facility foe is 0.055% of the total commitment. Under this committed credit Offered Rate (UBORT as of the beginning of the month of the invoice date. facility, the Company must maintain among other things, certain mnmu plus 0.75% specified financial ratios with which the Company was in complance at As of May 31, 2015 and 2014, the Company had no amounts outstanding May 31, 2015. No amounts were outstanding under this facility as of May 31, under its commercial paper program. 2015 o 2014 NOTE 8-Long-Term Debt Long-term debt.net of unamortized premiums and discounts and swap far value adustments, comprises the following: Book Value Outstanding As of May 31, Original interest Principal Rate Interest Payments 2015 2014 Scheduled Asturiy Dollars and Yen in millions Camart Pau NOTE 8 - Long-Term Debt + Long-tem debt, net ofunamortized premiums and discounts and swap far vale adjustments, comprises the following: Book Value Outstanding As of May 31. Original Interest Principal Rate Interest Payments 2015 2014 $ $ $ 100 500 500 5.15% 2.25% 3.63% Semi-Annually S Semi-Annually Semi-Annually 101 $ 499 499 108 499 499 Scheduled Maturity Dollars and Yen in millions Corporate Bond Payables: October 15, 2015 May 1, 2023 May 1. 20439 Promissory Notes: April 1, 2017 January 1, 2018 Japanese Yen Notes: August 20, 2001 through November 20, 2020 August 20, 2001 through November 20, 2020 Total Less current maturities TOTAL LONG-TERM DEBT $ S 40 19 6.20% 6.79% Monthly Monthly 39 19 39 19 v 9.000 V 4,000 2.60% 2.00% Quarterly Quarterly 20 9 1,186 107 1,079 $ 29 13 1.206 $ 1,199 The Company has entered into interest rate wao agreements whereby the Company receives Exed interest payments at the same rate as the note and pays arabe interest payments based on the six-month LIBOR pusa sprask The Swaps have the same notice amount and mustry datos de comesponding on. At May 31, 2015, the interest rats payable on these sw agroents god from promify 0.3% 100.5% @ The Company assumed a total of $59 milion n bonds payable as part of its agresit to purchase cortan Corporate properties as was brouted as a non-cash financing transaction. The property serves as coloral for the deal. The purchase of these properties was accounted for as a business contration where the total consideration of 385 milion was alocated to the and and buildings acquired: no other fangbormang bases robes resulted Homme purchase. The bonds maren 2017 and 2018 and the Company does not have the to re-negotiate the Sons of the debt agreements and woud noustantinopostes de notes were pad-off prior to maturity 3 NIKE Logistics YK assumed a total of 13.0 lion bars as part of its agreement to purchase a distribution contentapan, which serves as colateral by the bans. These armaturen qualquer installments during the period August 20, 2001 through November 20, 2020, These senior secured obligations rankogusly with the Company's other unsecured and ins.cord de techoss. (5 The bonds are radable at the Company's option prior to February 1, 2023 and November 1, 2042, respectively at a propagal to the goal of 100% of the aggregate panal amount of the notes to be moderned, and the sum of the present atas of the romaning Send payments, pus nach achat and unpad interest. Subsequent to February 1, 2023 and November 1, 2042, respectivay, the bonds ato turo a poco provon, which akor the bands to be resowadata pris equal to 100% of the aggregate prhopal amount of the notes being redeemed, pus scored and unpad interest The scheduled maturity of Long-term debt in each of the years ending The fair value of the Company's Long-term debt, including the current May 31, 2016 through 2020 are $106 milion, $44 million $24 milion $6 portion, was approximately $1,160 million at May 31, 2015 and $1.154 milion milion and $6 million, respectively, at face value. at May 31, 2014. The fair value of Long-term door is estimated based upon quoted prices of similar instruments (level 2). TAVA NOTE 9 - Income Taxes - Income before income taxes is as folows: Year Ended May 31, 2014 2015 2013 in millions) Income before income taxes: United States Foreion TOTAL INCOME BEFORE INCOME TAXES $ 1,967 $ 2.238 4,205 S 3.066 $ 478 3,544 $ 1.231 2.025 3.256 $ The provision for income taxes is as follows: + Year Ended May 31, 2014 2015 2013 An millions Current: United States Federal State 596 $ 80 259 $ 104 499 862 378 79 442 899 Foreign 389 1.045 Total Deferred: United States Federal State Foreign Total TOTAL INCOME TAX EXPENSE (66) (11) (36) (113) 932 $ 19 3 (3) 1271 (11) 851 $ 14 (88) 194 805 S Areconciliation from the U.S. statutory federal income tax rate to the elective income tax rate is as follows: Federal income tax rate State taxes, net of federal benefit Foreign earings Deferred charge Othernet EFFECTIVE INCOME TAX RATE Year Ended May 31, 2015 2014 35.0% 35.0% 0.9% 1.8% -15.7% 2.2% 0.9% - 14.6% 1.1% -0.4% 22.2% 24.0% 2013 35.0% 1.4% -11,8% 0.0% 0.1% 24.7% The effective tax rate from continuing operations for the year ended May 31 2015 was 180 basis points lower than the effective tax rate from continuing marine them me My 31 2014 mare in the favorable to During the fourth quarter of the fiscal year ended May 31, 2014, the Company reached a resolution with the IRS on a U.S. Unlateral Advanced Pricing Agreement that covers Intercompany transfer pricing for fiscal years 2011 ompany's effective income tax rate n fiscal 2014. Deferred tax assets and abilities) comprise the following: As of May 31. 2015 2014 A mions Deferred tax assets: Allowance for doubtful accounts Inventories Sales return reserves Deferred compensation Stock-based compensation Reserves and accrued liabilities Net operating loss carry.forwards Undistributed earnings of foreign subsidiaries Other Total deterred tax assets Valuation allowance Total deferred tax assets after valuation allowance Deferred tax liabilities: Property, plant and equipment Intangibles Other Total deferred tax liability NET DEFERRED TAX ASSET 11 $ 59 143 258 179 92 10 149 76 977 19 968 11 49 113 211 162 95 16 194 51 902 19 893 (220) (93) (38) 351) 617 S (237) (94) 12 333 560 S + The folowing is a reconciliation of the changes in the gross balance of unrecognized tax benefits: As of May 31 An millions 2015 2014 2013 Unrecognized tax benefits, beginning of the period 506 $ 447 $ 285 Gross increases related to prior period tax positions 32 814 77 Gross decreases related to prior period tax positions: (123) (166) 3 Gross increases related to current period tax positions 82 125 130 Gross decreases related to current period tax positions (9) (30) Settlements (27) (676) Lapse of statute of limitations (10) (4) (21) Changes due to currency translation (13) 14) (12) UNRECOGNIZED TAX BENEFITS, END OF THE PERIOD $ 438 S 506 S 447 I During the future of the few yowded May 31, 2014, the Company reached ancortion with this on aus. UnterAchanced Picng Agromontoris.covers terreny ia Mowglade summaries the company's total stock-based compensation expense recognized in Operating overhead expense: Year Ended May 31. familions 2015 2014 Stock options 8 136 $ 125 ESPPS 24 22 Restricted stock 31 30 TOTAL STOCK-BASED COMPENSATION EXPENSE S 191 S 177 2013 123 19 32 174 $ (1) Esperse for stock options includes the expense associated with stock preconights. Accelerated stockapoonexpenses recorded for employees ble braccorated stooption vesting upon retromont. Accelerated stock option parise for the years onded May 31, 2015, 2014 and 2013 was $19 milion $15 million and 52 million, respectively, As of May 31, 2015, the Company had $180 milion of unrecognized recognized in Coerating overhead expense over a weighted average period of compensation costs from stock options, net of estimated for entures, to be 1.9 years. The weighted average far value per share of the options granted during the years ended May 31, 2015, 2014 and 2013, as computed using the Black-Scholes priong model was $16.95 $14.89 and $12.71, respectively. The weighted average assumptions used to estimate these fair values are as follows: Year Ended May 31, 2015 2014 2013 Dividend yield 1.2% 1.3% Expected volatility 1.5% 23.6% 27.9% 35.0% Weighted average expected life in years) 5.8 5.3 5.3 Risk-free interest rate 1.7% 1396 0.69 The Company estimates the expected volatility based on the implied volatility future exercise patterns. The interest rate is based on the U.S. Treasury in market traded options on the Company's common stock with a term constant maturity risk-free rate in effect at the date of grant for periods greater than one year, along with other factors. The weighted average corresponding with the expected term of the options expected life of options is based on an analysis of historical and expected The folowing summarizes the stock option transactions under the plan discussed above. Weighted Average Sharest Option Price din millions Options outstanding May 31, 2012 64.3 $ 30.59 Exercised (9.9) 24.70 Forfeited (1.3) 40.14 Granted 14,6 46.55 Options outstanding May 31, 2013 67.7 $ 34.72 Exercised (11.0 28.29 Forfeited (1.3) 48.33 Granted 8:1 63.54 Options outstanding May 31, 2014 63.5 S 39.28 Exercises (13.6 30.78 Forfeited (1.0 59.02 Granted 9.2 77.68 Options outstanding May 31, 2015 58.1 $ 47.00 Options exercisable at May 31, 2013 35.9 $ 27.70 2014 37.0 31.42 2015 36.53 34.3 ( auch so apreciation is actions ung end of the offering period. Employees purchased 1.4 milion, 1.4 million and 1.6 million shares during each of the three years ended May 31, 2015, 2014 and 2013. respectively recognized in Operating overhead expense over a weighted average period of 1.5 years NOTE 12-Earnings Per Share The following is a reconciliation from Basic earnings per common share to Diuted earnings per common share. The computation of Diluted earnings per common share omitted options to purchase an additional 0.1 milion 0.1 milion and 0.1 milion shares of common stock outstanding for the years ended May 31, 2015, 2014 and 2013, respectively, because the options were anti-cutive Year Ended May 31, dn millions except per share catal 2015 2014 2013 Determination of shares: Weighted average common shares outstanding 861.7 883.4 897.3 Assumed conversion of dilutive stock options and awards 22.7 22.4 19.1 DILUTED WEIGHTED AVERAGE COMMON SHARES OUTSTANDING 884.4 905.8 916.4 Earnings per common share from continuing operations: Basic Diuted 3.80 $ 3.70 S 3.05 $ 2.97 $ 2.74 2.68 Earnings per common share from discontinued operations: Basic Diuted $ 0.02 0.02 Basic earnings per common share for NIKE, Inc. Diluted earnings per common share for NIKE, Inc. 3.80 $ 3.70 $ 3.05 $ 2.97 $ 2.76 2.70 NOTE 13 Benefit Plans The Company has a qualified 40106 Savings and Profit Sharing Plan to which al U.S. employees who work at least 1,000 hours in a year are able to participate. The Company matches a portion of employee contributions. Company contributions to the savings plan were $58 milion, 851 milion and S46 million for the years ended May 31, 2015, 2014 and 2013, respectively, and are incuded in Operating overhead expense. The terms of the pl plan also alow for annual discretionary prof sharing contributions to the accounts of eigble employees by the Company as determined by the Board of Directors. Contributions of $58 million, $49 million and $47 milion were made to the plan and are included in Operating overhead expense for the years ended May 31, 2015, 2014 and 2013, respectively. The Company also has a long-Term Incentive Pan ("LTP that was adopted under the LTIP during the years ended May 31, 2015, 2014 and 2013 respectively The Company allows certain highly compensated employees and non- employee directors of the Company to defer compensation under a nonqualified deferred compensation plan. Deferred compensation plan Kablities were $443 milion and $390 milion at May 31, 2015 and 2014, respectively, and primarly classified as long-term in Deferred ncome taxes and other abities. The Company has pension plans in various countries worldwide. The pension plans are only available to bocal employees and are generaly government mandated. The labity related to the unlunded pension labies of the plans was $98 milion and $100 million at May 31, 2015 and May 31, 2014 107 NOTE 14 - Accumulated Other Comprehensive Income - The changes in Accumulated other comprehensive income, net of tax were as follows: Foreign Currency Cash Not Translation Flow Investment An millions ) Adjustment Hedges Hedges! Other Total Balance at May 31, 2014 $ 9 $ 32 s $ 95 $ (51) $ S 85 Other comprehensive gains fosses) before reclassifications (20) 1,447 33 1.480 Reclassifications to net income of previously deferred (gains) losses - (259) (40) (299) Other comprehensive income foss) -20 1.188 17) 1,161 Balance at May 31, 2015 $ (11) $ 1,220 $ 95 $ (58) $ 1.246 (1) The accumulated foregn currency raration austrant and nervesbient hedge gansosses related to a rivestment in a forensesday we reclassified to Mathcome upon sale or upon comporta con todo tion of the respective only @ Nexofta benets of $0 million $3 milion milion $0 milionand millones Net of tax band of milion $2 milk Smilion $0 mibonand2 millones Foreign Currency Cash Net Translation Flow Investment On millions Adjustment Hedges Hedgesin Other Total Balance at May 31, 2013 $ 41 $ 193 $ 95 $ (55 S 274 Other comprehensive gans fosses) before reclassifications (32) (134) (166) Reclassifications to net income of previously deferred (gains) losses ) (27) - 4 (23) Other comprehensive income foss 32) (161) 4 189 Balance at May 31, 2014 $ 9 S 32 $ 95 S (51) $ 85 The accumulated foreign currency translation acustrent and not remont hale gars/osse med banana oraignesy we recessifed to Nel come upon sabor upon complete or scompte udation of the respective antity Net of tax benefit perse or omilion $9 milion milion, 50 million and $9mon respective Netotax toner) expense of smilion $9 milion Somon, smand $9 milion respecte The following table summarizes the reclassifications from Accurated other comprehensive ncome to the Consolidated Statements of income Amount of Gain (Loss) Roclassified from Accumulated Other Comprehensive Income Into Income Location of Gain (Loss) Reclassified from Accumulated Other Comprehensive Income Year Ended May 31, into Income en millions 2015 2014 Gains fosses) on cash flow hedges: Foreign exchange forwards and options $ (95) S 14 Revenues Foreign exchange forwards and options 220 12 Cost of sales Foreign exchange forwards and options Total selling and administrative expense Foreion exchange forwards and cotions 136 10 Other (income) expense.net Total before tax 261 36 Tax expense 121 101 Gain, net of tax 259 27 Gains (503) on other 40 14) Other Income expense net Total before tax 40 (4) Tax expense Gain loss), net of tax 40 10 Total net gain reclassified for the period 2995 23 OUR LOCOCO OF UZUN GO LOOD FULL VID FUSILEIS Asset Derivatives Balance Sheet Location 2015 Liability Derivatives Balance Sheet Location 2015 2014 2014 825 $ 76 Accrued abilities $ 140 S $ 57 78 Prepaid expenses and s other current assets Prepaid expenses and other current assets Deferred Income taxes and other assets Deferred income taxes and other assets 520 Anions) Derivatives formally designated as hedging instruments: Foreign exchange forwards and options Interest rate swaps Foregn exchange forwards and options Interest rate swaps Total derivatives formaly designated as hedging instruments Derivatives not designated as hedging instruments: Foreign exchange forwards and options Embedded derivatives 4 Accrued abilities 26 Deferred income taxes and other abilities 6 6 Deferred income taxes and other labilities 1,423 108 144 58 209 25 Accrued liabilities 20 27 Prepad expenses and other current assets Prepaid expenses and other current assets Deferred income taxos and other assets 2 2 Accrued abdities 5 Embedded derivatives 9 Deferred income taxes and other liabilities 216 25 31 27 Total derivatives not designated as hedging instruments TOTAL DERIVATIVES S 133 1,639 $ S 175 S 85 The following tables present the amounts affecting the Consolidated Statements of Income for years ended May 31, 2015, 2014 and 2013: Amount of Gain (Loss) Recognized in Other Amount of Gain (Loss) Comprehensive Income Reclassified From Accumulated on Derivatives Other Comprehensive Income into Income Year Ended May 31 Location of Gain (Loss) Year Ended May 31, Reclassified From Accumulated Other Ain millions 2015 2014 2013 Comprehensive Income Into Incomer 2015 2014 2013 Derivatives designated as cash flow hedges: Foreign exchange forwards and options $ (202) $ (48) $ 42 Revenues $ 95) $ 14 $ (19) Foreign exchange forwards and options 1,109 ) (78) 67 Cost of sales 220 12 113 Foreign exchange forwards and options 4 Total seling and administrative expense 2. Foreign exchange forwards and options 497 (21) 33 Other income) expense.net 136 10 9 Interest rate swaps 76 Interest expense (neome.net Total designated cash flow hedges $1,480 $(143) $ 139 $261 $ 36 $105 Derivatives designated as net investment hedges Foreign exchange forwards and options $ Other income) expense, net $ $$$ For me years anded May 31, 2015 2014 and 2013, the amounts reconocomgrense, nefas a result of badge netectveness and the disconne och tow hedges because the world besactions were no bnger probabili focurring were material Amount of Gain (Loss) Recognized in Income on Derivatives Year Ended May 31, 2015 2014 2013 Location of Gain (Loss) Recognized in Income on Derivatives $ 5 $ 5 $ 5 Interest expense (income). net Armillons Derivatives designated as fair value hedges: Interest rate swaps Derivatives not designated as hedging instruments: Foreign exchange forwards and options Embedded derivatives 611 $ (US ( (75) $ OS 51 4 Other (income) expense, net Other (income) expense, net S Anterest rate was designated as far vale edgesmee me shortcut method requerents under the accounting standarts border Wahes and hedon. According anges in the burvals of the newest was consided locally off changes in the frame of the underlyinging tome key to Far Vaka Hedgehobradowda Refor to Note 6 - Fair Value Measurements for a description of how the Equity for additional information on changes in other comprehensive income above financial instruments are valued and Note 14 - Accumulated Other for the years ended May 31, 2015, 2014 and 2013 Como Income and the Console Sons of Sharan 15 Year Ended May 31, 2014 + 2015 2013 $ Anillora REVENUES North America Western Europe Central & Eastern Europe Greater China Japan 13,740 $ 5,709 1,417 3,067 755 3.898 115 28.701 1.982 (82 30,601 S 12.299 S 4.979 1.387 2.602 771 3,949 125 26.112 1.684 3 27,799 $ 11,158 4,193 1,220 2.478 876 3,832 115 23,881 1,449 (17) 25,313 S $ 3.645 $ 1.277 247 933 100 818 (2.263 4,817 517 (1.101) 4.233 28 4,205 $ 3.077 $ 855 279 816 131 952 (1.983) 4,117 496 (1.036) 3.577 33 3.544 $ 2,639 643 234 813 139 995 (1.716) 3.737 425 1909) 3.253 13 3.256 S $ $ Emerging Markets Global Brand Divisions Total NIKE Brand Converse Corporate TOTAL NIKE CONSOLIDATED REVENUES EARNINGS BEFORE INTEREST AND TAXES North America Western Europe Central & Eastern Europe Greater China Japan Emerging Markets Global Brand Divisions Total NIKE Brand Converse Corporate Total NIKE Consolidated Earnings Before Interest and Taxes Interest expense (income), net TOTAL NIKE CONSOLIDATED EARNINGS BEFORE TAXES ADDITIONS TO LONG-LIVED ASSETS North America Western Europe Central & Eastern Europe & Greater China Japan Emerging Markets Global Brand Divisions Total NIKE Brand Converse Corporate TOTAL ADDITIONS TO LONG-LIVED ASSETS DEPRECIATION North America Western Europe Central & Eastern Europe Greater China Japan Emerging Markets Global Brand Divisions Total NIKE Brand Converse Corporate TOTAL DEPRECIATION 208 $ 216 20 69 15 37 225 790 69 240 S 120 19 63 9 9 55 225 731 30 161 922 S 132 75 22 52 7 50 270 608 20 153 781 144 S 1,003 $ $ 121 $ 75 12 46 22 27 210 513 18 75 606 $ 109 $ 71 11 38 19 25 175 448 16 54 518 S 92 68 9 32 22 20 122 385 15 38 418 $ As of May 31, 5 As of May 31, 2015 2014 + IS S 1.737 $ 344 242 84 134 481 88 3.090 258 TO 3.358 $ 1,505 341 290 200 69 162 819 71 3,246 171 17 3,434 S S In millions) ACCOUNTS RECEIVABLE, NET North America Western Europe Central & Eastern Europe Greater China Japan Emerging Markets Global Brand Divisions Total NIKE Brand Converse Corporate TOTAL ACCOUNTS RECEIVABLE, NET mer INVENTORIES North America Western Europe Central & Eastern Europe Greater China Japan Emerging Markets Global Brand Divisions Total NIKE Brand Converse Corporate TOTAL INVENTORIES PROPERTY, PLANT AND EQUIPMENT, NET North America Western Europe Central & Eastern Europe Greater China Japan Emerging Markets Global Brand Divisions Total NIKE Brand Converse Corporate TOTAL PROPERTY, PLANT AND EQUIPMENT, NET 2.207 S $ 699 169 249 94 528 32 3,978 237 122 4.337 $ 1.758 711 271 221 94 633 18 3.708 261 (20 3,947 S $ $ 632 $ 451 47 254 205 103 484 2.176 122 713 3,011 $ 545 384 51 20 282 258 115 537 2.122 70 642 2,834 $ Revenues by Major Product Lines Reveries to extend oustomers to NIKE Brand products are attributable to sales of footwear, apparel and equipment. Other revenues to extemal austomers consist primarily of sales by Converse $ an milions) Footwear Apparel Equipment Other TOTAL NIKE CONSOLIDATED REVENUES 2015 18,318 8.636 1.632 2015 30,601 Year Ended May 31 2014 S 16.208 $ 8.109 1.670 1,812 S 27,799 $ 2013 14,635 7.491 1,640 1.547 25 313 S Rayonund lang im WTA S1877 min am S1652. my 2 mm May 31 2015 and numbers and per share amounts presented reflect the stock split NIKE, Inc. Unaudited Condensed Consolidated Statements of Cash Flows Three Months Ended August 31, 2014 Six Months Ended November 30, 2014 As As As As Reported Adjustment Revised Reported Adjustment Revised $ 962 $ -- $ 962 $ 1,617 $ - S 1.617 (34) (54) In milions) Cash provided by operations: Net Income Income charges (credits) not affecting cash: Amortization and other Net foreign currency adjustments Cash provided by operations Elect of exchange rate changes on cash and equivalents Net increase (decrease) in cash and equivalents Cash and equivalents, beginning of period CASH AND EQUIVALENTS, END OF PERIOD 42 53 96 (95) 8 53 683 2 83 2.220 2,303 69 243 312 (312) 588 97 83 2.220 2,303 $ 15 243 1,547 (24) 53 2.220 2,273 1.235 288 53 2.220 2,273 $ - $ - S $ - $ The following are selected line items from the Company's Consolidated Statements of Cash Flows ilustrating the effect of these corrections on the amounts previously reported in the Company's fiscal 2014 Annual Report on Form 10-K; + NIKE, Inc. Consolidated Statements of Cash Flows Year Ended May 31, 2014 Year Ended May 31, 2013 As As As As Reported Adjustment Revised Reported Adjustment Revised $ 2,693 $ - $ 2,693 $ 2,472 $ $ 2,472 114 66 fin millions Cash provided by operations: Net income Income charges (credits) not affecting cash: Ammortization and other Net foreign currency adjustments Cash provided by operations Effect of exchange rate changes on cash and equivalents Net increase (decrease) in cash and equivalents Cash and equivalents, beginning of year CASH AND EQUIVALENTS, END OF YEAR (46) 56 10 (10) 3.003 1 (1.117) 3,337 $ 2.220 S 68 56 3,013 (9) (1.117) 3.337 $ 2,220 2.968 100 1.083 2.254 $ 3,337 $ (2) 64 66 66 64 3.032 (64) 36 1,083 2.254 - S 3,337 Recognition of Revenues appears. Costs related to brand events are expensed when the event occurs. Costs related to retail brand presentation are expensed when the presentationis completed and delivered non tamitha risken moet NOTE 3 - Property, Plant and Equipment Property, plant and equipment, net incuded the folowng: 2015 1,066 As of May 31. din millions 2014 Land 273 $ 270 Buildings 1.250 1.261 Machinery, equipment and internal-use software 3,329 3,376 Leasehold improvements 1.150 Construction in process 350 247 Total property, plant and equipment, gross 6,352 6.220 Less accumulated depreciation 3.341 3.386 TOTAL PROPERTY, PLANT AND EQUIPMENT, NET $ 3.011 S 2.834 Capitalized interest was not material for the years ended May 31, 2015, 2014 and 2013. The Company had $5 milion and $74 milion in capital lease obligations as of May 31, 2015 and May 31, 2014, respectively, induded in machinery, equipment and internal-use software. During the fiscal year ended May 31, 2015, the Company restructured the terms of certain capital eases, which now quality as operating leases NOTE 4 - Identifiable Intangible Assets and Goodwill Identifiable intangible assets, net consists of indefinite-ived trademarks, whch are not subject to amortization, and acquired trademarks and other intangible assets, which are subject to amortization. At May 31, 2015 and 2014. indefinite-ived trademarks were $281 milion and $282 milion, respectively Acquired trademarks and other intang ble assets at May 31, 2015 and 2014 were $17 million and $39 million, respectively and were fully amortized at the end of both periods. Goodwill was $131 million at May 31, 2015 and 2014 of which $65 million and $64 million were included in the Converse segment in the respective periods. The remaining amounts were included in Global Brand Divisions for segment reporting purposes. There were no accumulated impairment balances for goodwl as of either period end NOTE 5 - Accrued Liabilities Accrued abilities included the following: $ an millions) Compensation and benefits, excluding taxes Collateral received from counterparties to hedging instruments Endorsement compensation Dividends payable Import and logistics costs Taxes other than income taxes Far value of derivatives Advertising and marketing Others TOTAL ACCRUED LIABILITIES As of May 31, 2015 2014 997 $ 782 968 388 328 240 209 207 127 174 204 162 85 117 139 898 623 3.951 S 2.491 S NOTE 6 - Fair Value Measurements The following tables present information about the Company's financial assets and abilities measured at tair value on a recurring basis as of May 31, 2015 and 2014 and indicate the fair value hierarchy of the valuation techniques utilized by the Company to determine such tar value. Refer to Note 1 - Summary of Significant Accounting Policies for additional detail regarding the Company's far value measurement methodology. As of May 31, 2015 Assets at Fair Cash and Cash Short-term Value Equivalents Investments $ 615 $ Other Long-term Assets 615 $ 869 225 644 an millions Cash Level 1: U.S. Treasury securities Level 2 Time deposits U.S. Agency securities Commercial paper and bonds Money market funds Total level 2 Level 3: Non-marketable preferred stock TOTAL 684 976 914 1,866 4,440 684 110 352 1.866 3.012 886 562 1,428 8 5.932 $ $ 3,852 $ 2,072 S As of May 31, 2014 Assets at Fair Cash and Cash Short-term Value Equivalents Investments 780$ 780 $ Other Long-term Assets 1,137 151 988 An milions Cash Level 1: U.S. Treasury securities Level 2: Time deposits U.S. Agency securities Commercial paper and bonds Money market funds Total level 2 Level 3: Non-marketable preferred stock TOTAL 227 1,027 959 1,012 3.225 227 25 25 1.012 1.289 1.002 934 1.936 7 5,149 $ $ 2,220 S 2,922 S The Company elects to record the gross assets and liabities of its derivative financial instruments on the Consolidated Balance Sheets. The Company's derivative financial instruments are subject to master netting arrangements that allow for the oftset of assets and kablities in the event of default or early termination of the contract. Any amounts of cash colateral received related to these instruments associated with the Company's crecie-related contingent features are recorded in Cash and equivalents and Accrued labies, the latter which would further offset against the Company's derivative asset balance refer to Note 17 - Risk Management and Derivatives). Cash collateral received related to the Company's credit related contingent features is presented in the Cash provided by operations component of the Consolidated Statement of Cash Flows. Any amounts of non-cash colateral received, such as securities, are not recorded on the Consolidated Balance Sheets pursuant to the accounting standards for non-cash collateral recorved dows. Aty amounts of non-cash collateral these instruments associated with the Company's credit-related contingent received, such as securities, are not recorded on the Consoidated Balance features are recorded in Cash and equivalents and Accrued labikties the Shoots pursuant to the accounting standards fornon-cash collateral received The following tables present information about the Company's derivative assets and liabilties measured at far value on a recurring basis as of May 31, 2015 and May 31, 2014, and indicate the level in the fair value Hierarchy in which the Company classifies the far value measurement. As of May 31, 2015 Derivative Assets Derivative Liabilities Other Other Assets Other Liabilities Long- at Fair Current term at Fair Accrued term Value Assets Assets Value Liabilities Labilities Long- de millions Level 2: Foreign exchange forwards and options Embedded derivatives Interest rate swaps TOTAL 4 520 $ 5 5 164 $ 11 $ 1.554 S 1,034 $ 7 2 78 78 $ 1,639 S 1,114 S 160 $ 2. 9 525 $ 175 s 162 s 13 it the foreign exchange debate instruments had been notted in the Corso do Banco Shoes, the assor and by positions each would have been reduced by $161 million as of May 31, 2015 As of War at the Company had received 8900 milion of ash color $74 milion of sources from various autoparties rated to the foreign exchange derivative instruments. No amount of codawa/was posted on the company's devotos of May 31, 2015 As of May 31, 2015, the Company had received $68 milionofakchotterelated to enterest rate was As of May 31, 2014 Derivative Assets Derivative Liabilities Other Other Assets Other Long- Liabilities Long- at Fair Current term at Fair Accrued term Value Assets Assets Value Liabilities Liabilities eln millions) Level 2 Foreign exchange forwards and options) Interest rate swaps TOTAL $ 101 $ 85 $ 84 $ 1 127 $ 6 133 $ 26 $ 6 32 $ $ 101 S 85 S 84 S 1 We troixchigo de motive from struments had been retted in the Conske Bano Sheets, the asset and ability postions och woh boondood by 883 min as of My 31, 2014. Nanents of colore recovedor posed on the Company's divavessat and is as of My 31, 2014 Available for sale securities comprise investments in U.S. Treasury and The Company's Level 3 assets comprise investments in certain non- Agency securities, money market funds, corporate commercial paper and marketable preferred stock. These Level 3 investments are an immaterial bonds. These securities are valued using market prices on both active portion of the Company's portfolio. Changes in Level 3 investment assets markets (Level 1) and less active markets (Level 2). The gross realized gains were immaterial during the years ended May 31, 2015 and 2014, and losses on sales of avalable-for-sale securties were immaterial for the fiscal years ended May 31, 2015 and 2014. Unrealzed gains and losses on Derivative fnancial Instruments include foreign exchange forwards and available for sale securities included in other comprehensive income were options, embedoed derivatives and interest rate swaps. Refer to Note 17 - Risk Management and Derivatives for additional detal NOTE 7 - Short-Term Borrowings and Credit Lines Notes payable and interest-bearing accounts payable to Soitz Corporation of America Sojtz America) as of May 31, 2015 and 2014 are summarized below: As of May 31, 2015 2014 Dotasin millions Borrowings Interest Rate Borrowings Interest Rate Notes payable: U.S. operations $ 0.00% $ 0.00%! Non-U.S. operations 74 12.39% 167 10.049615 TOTAL NOTES PAYABLE $ 74 $ 167 Interest-bearing accounts payable: So tz America $ 78 0.98% $ 60 0.94% (1) Weighted average interest ratonces non torst boringowdats The carrying amounts reflected in the Consolidated Balance Sheets for Notes On November 1, 2011, the Company entered into a committed credit facility payable approximate fair value. agreement with a syndicate of banks which provides for up to $1 billion of The Company purchases through Sojtz America certain NIKE Brand borrowings with the option to increase borrowings to $1.5 billion with lender products it acquires from non-U.S. supplers. These purchases are for approval . Folowing an extension agreement on September 17, 2013 products sold in certain countries n the Company's Emerging Markets between the Company and the syndicate of banks, the facity matures November 1, 2017. Based on the Company's current long-term senior geographic operating segment and Canada, excluding products produced unsecured debt ratings of AA- and Al trom Standard and Poor's Corporation and sold in the same country. Accounts payable to Sojtz America are and Moody's Investor Services, respectively, the interest rate charged on any generally due up to 60 days after shipment of goods from the foreign port. The interest rate on such accounts payable is the 50-day London Interbank outstanding borrowings would be the prevailing LBOR pus 0.445%. The WS facility foe is 0.055% of the total commitment. Under this committed credit Offered Rate (UBORT as of the beginning of the month of the invoice date. facility, the Company must maintain among other things, certain mnmu plus 0.75% specified financial ratios with which the Company was in complance at As of May 31, 2015 and 2014, the Company had no amounts outstanding May 31, 2015. No amounts were outstanding under this facility as of May 31, under its commercial paper program. 2015 o 2014 NOTE 8-Long-Term Debt Long-term debt.net of unamortized premiums and discounts and swap far value adustments, comprises the following: Book Value Outstanding As of May 31, Original interest Principal Rate Interest Payments 2015 2014 Scheduled Asturiy Dollars and Yen in millions Camart Pau NOTE 8 - Long-Term Debt + Long-tem debt, net ofunamortized premiums and discounts and swap far vale adjustments, comprises the following: Book Value Outstanding As of May 31. Original Interest Principal Rate Interest Payments 2015 2014 $ $ $ 100 500 500 5.15% 2.25% 3.63% Semi-Annually S Semi-Annually Semi-Annually 101 $ 499 499 108 499 499 Scheduled Maturity Dollars and Yen in millions Corporate Bond Payables: October 15, 2015 May 1, 2023 May 1. 20439 Promissory Notes: April 1, 2017 January 1, 2018 Japanese Yen Notes: August 20, 2001 through November 20, 2020 August 20, 2001 through November 20, 2020 Total Less current maturities TOTAL LONG-TERM DEBT $ S 40 19 6.20% 6.79% Monthly Monthly 39 19 39 19 v 9.000 V 4,000 2.60% 2.00% Quarterly Quarterly 20 9 1,186 107 1,079 $ 29 13 1.206 $ 1,199 The Company has entered into interest rate wao agreements whereby the Company receives Exed interest payments at the same rate as the note and pays arabe interest payments based on the six-month LIBOR pusa sprask The Swaps have the same notice amount and mustry datos de comesponding on. At May 31, 2015, the interest rats payable on these sw agroents god from promify 0.3% 100.5% @ The Company assumed a total of $59 milion n bonds payable as part of its agresit to purchase cortan Corporate properties as was brouted as a non-cash financing transaction. The property serves as coloral for the deal. The purchase of these properties was accounted for as a business contration where the total consideration of 385 milion was alocated to the and and buildings acquired: no other fangbormang bases robes resulted Homme purchase. The bonds maren 2017 and 2018 and the Company does not have the to re-negotiate the Sons of the debt agreements and woud noustantinopostes de notes were pad-off prior to maturity 3 NIKE Logistics YK assumed a total of 13.0 lion bars as part of its agreement to purchase a distribution contentapan, which serves as colateral by the bans. These armaturen qualquer installments during the period August 20, 2001 through November 20, 2020, These senior secured obligations rankogusly with the Company's other unsecured and ins.cord de techoss. (5 The bonds are radable at the Company's option prior to February 1, 2023 and November 1, 2042, respectively at a propagal to the goal of 100% of the aggregate panal amount of the notes to be moderned, and the sum of the present atas of the romaning Send payments, pus nach achat and unpad interest. Subsequent to February 1, 2023 and November 1, 2042, respectivay, the bonds ato turo a poco provon, which akor the bands to be resowadata pris equal to 100% of the aggregate prhopal amount of the notes being redeemed, pus scored and unpad interest The scheduled maturity of Long-term debt in each of the years ending The fair value of the Company's Long-term debt, including the current May 31, 2016 through 2020 are $106 milion, $44 million $24 milion $6 portion, was approximately $1,160 million at May 31, 2015 and $1.154 milion milion and $6 million, respectively, at face value. at May 31, 2014. The fair value of Long-term door is estimated based upon quoted prices of similar instruments (level 2). TAVA NOTE 9 - Income Taxes - Income before income taxes is as folows: Year Ended May 31, 2014 2015 2013 in millions) Income before income taxes: United States Foreion TOTAL INCOME BEFORE INCOME TAXES $ 1,967 $ 2.238 4,205 S 3.066 $ 478 3,544 $ 1.231 2.025 3.256 $ The provision for income taxes is as follows: + Year Ended May 31, 2014 2015 2013 An millions Current: United States Federal State 596 $ 80 259 $ 104 499 862 378 79 442 899 Foreign 389 1.045 Total Deferred: United States Federal State Foreign Total TOTAL INCOME TAX EXPENSE (66) (11) (36) (113) 932 $ 19 3 (3) 1271 (11) 851 $ 14 (88) 194 805 S Areconciliation from the U.S. statutory federal income tax rate to the elective income tax rate is as follows: Federal income tax rate State taxes, net of federal benefit Foreign earings Deferred charge Othernet EFFECTIVE INCOME TAX RATE Year Ended May 31, 2015 2014 35.0% 35.0% 0.9% 1.8% -15.7% 2.2% 0.9% - 14.6% 1.1% -0.4% 22.2% 24.0% 2013 35.0% 1.4% -11,8% 0.0% 0.1% 24.7% The effective tax rate from continuing operations for the year ended May 31 2015 was 180 basis points lower than the effective tax rate from continuing marine them me My 31 2014 mare in the favorable to During the fourth quarter of the fiscal year ended May 31, 2014, the Company reached a resolution with the IRS on a U.S. Unlateral Advanced Pricing Agreement that covers Intercompany transfer pricing for fiscal years 2011 ompany's effective income tax rate n fiscal 2014. Deferred tax assets and abilities) comprise the following: As of May 31. 2015 2014 A mions Deferred tax assets: Allowance for doubtful accounts Inventories Sales return reserves Deferred compensation Stock-based compensation Reserves and accrued liabilities Net operating loss carry.forwards Undistributed earnings of foreign subsidiaries Other Total deterred tax assets Valuation allowance Total deferred tax assets after valuation allowance Deferred tax liabilities: Property, plant and equipment Intangibles Other Total deferred tax liability NET DEFERRED TAX ASSET 11 $ 59 143 258 179 92 10 149 76 977 19 968 11 49 113 211 162 95 16 194 51 902 19 893 (220) (93) (38) 351) 617 S (237) (94) 12 333 560 S + The folowing is a reconciliation of the changes in the gross balance of unrecognized tax benefits: As of May 31 An millions 2015 2014 2013 Unrecognized tax benefits, beginning of the period 506 $ 447 $ 285 Gross increases related to prior period tax positions 32 814 77 Gross decreases related to prior period tax positions: (123) (166) 3 Gross increases related to current period tax positions 82 125 130 Gross decreases related to current period tax positions (9) (30) Settlements (27) (676) Lapse of statute of limitations (10) (4) (21) Changes due to currency translation (13) 14) (12) UNRECOGNIZED TAX BENEFITS, END OF THE PERIOD $ 438 S 506 S 447 I During the future of the few yowded May 31, 2014, the Company reached ancortion with this on aus. UnterAchanced Picng Agromontoris.covers terreny ia Mowglade summaries the company's total stock-based compensation expense recognized in Operating overhead expense: Year Ended May 31. familions 2015 2014 Stock options 8 136 $ 125 ESPPS 24 22 Restricted stock 31 30 TOTAL STOCK-BASED COMPENSATION EXPENSE S 191 S 177 2013 123 19 32 174 $ (1) Esperse for stock options includes the expense associated with stock preconights. Accelerated stockapoonexpenses recorded for employees ble braccorated stooption vesting upon retromont. Accelerated stock option parise for the years onded May 31, 2015, 2014 and 2013 was $19 milion $15 million and 52 million, respectively, As of May 31, 2015, the Company had $180 milion of unrecognized recognized in Coerating overhead expense over a weighted average period of compensation costs from stock options, net of estimated for entures, to be 1.9 years. The weighted average far value per share of the options granted during the years ended May 31, 2015, 2014 and 2013, as computed using the Black-Scholes priong model was $16.95 $14.89 and $12.71, respectively. The weighted average assumptions used to estimate these fair values are as follows: Year Ended May 31, 2015 2014 2013 Dividend yield 1.2% 1.3% Expected volatility 1.5% 23.6% 27.9% 35.0% Weighted average expected life in years) 5.8 5.3 5.3 Risk-free interest rate 1.7% 1396 0.69 The Company estimates the expected volatility based on the implied volatility future exercise patterns. The interest rate is based on the U.S. Treasury in market traded options on the Company's common stock with a term constant maturity risk-free rate in effect at the date of grant for periods greater than one year, along with other factors. The weighted average corresponding with the expected term of the options expected life of options is based on an analysis of historical and expected The folowing summarizes the stock option transactions under the plan discussed above. Weighted Average Sharest Option Price din millions Options outstanding May 31, 2012 64.3 $ 30.59 Exercised (9.9) 24.70 Forfeited (1.3) 40.14 Granted 14,6 46.55 Options outstanding May 31, 2013 67.7 $ 34.72 Exercised (11.0 28.29 Forfeited (1.3) 48.33 Granted 8:1 63.54 Options outstanding May 31, 2014 63.5 S 39.28 Exercises (13.6 30.78 Forfeited (1.0 59.02 Granted 9.2 77.68 Options outstanding May 31, 2015 58.1 $ 47.00 Options exercisable at May 31, 2013 35.9 $ 27.70 2014 37.0 31.42 2015 36.53 34.3 ( auch so apreciation is actions ung end of the offering period. Employees purchased 1.4 milion, 1.4 million and 1.6 million shares during each of the three years ended May 31, 2015, 2014 and 2013. respectively recognized in Operating overhead expense over a weighted average period of 1.5 years NOTE 12-Earnings Per Share The following is a reconciliation from Basic earnings per common share to Diuted earnings per common share. The computation of Diluted earnings per common share omitted options to purchase an additional 0.1 milion 0.1 milion and 0.1 milion shares of common stock outstanding for the years ended May 31, 2015, 2014 and 2013, respectively, because the options were anti-cutive Year Ended May 31, dn millions except per share catal 2015 2014 2013 Determination of shares: Weighted average common shares outstanding 861.7 883.4 897.3 Assumed conversion of dilutive stock options and awards 22.7 22.4 19.1 DILUTED WEIGHTED AVERAGE COMMON SHARES OUTSTANDING 884.4 905.8 916.4 Earnings per common share from continuing operations: Basic Diuted 3.80 $ 3.70 S 3.05 $ 2.97 $ 2.74 2.68 Earnings per common share from discontinued operations: Basic Diuted $ 0.02 0.02 Basic earnings per common share for NIKE, Inc. Diluted earnings per common share for NIKE, Inc. 3.80 $ 3.70 $ 3.05 $ 2.97 $ 2.76 2.70 NOTE 13 Benefit Plans The Company has a qualified 40106 Savings and Profit Sharing Plan to which al U.S. employees who work at least 1,000 hours in a year are able to participate. The Company matches a portion of employee contributions. Company contributions to the savings plan were $58 milion, 851 milion and S46 million for the years ended May 31, 2015, 2014 and 2013, respectively, and are incuded in Operating overhead expense. The terms of the pl plan also alow for annual discretionary prof sharing contributions to the accounts of eigble employees by the Company as determined by the Board of Directors. Contributions of $58 million, $49 million and $47 milion were made to the plan and are included in Operating overhead expense for the years ended May 31, 2015, 2014 and 2013, respectively. The Company also has a long-Term Incentive Pan ("LTP that was adopted under the LTIP during the years ended May 31, 2015, 2014 and 2013 respectively The Company allows certain highly compensated employees and non- employee directors of the Company to defer compensation under a nonqualified deferred compensation plan. Deferred compensation plan Kablities were $443 milion and $390 milion at May 31, 2015 and 2014, respectively, and primarly classified as long-term in Deferred ncome taxes and other abities. The Company has pension plans in various countries worldwide. The pension plans are only available to bocal employees and are generaly government mandated. The labity related to the unlunded pension labies of the plans was $98 milion and $100 million at May 31, 2015 and May 31, 2014 107 NOTE 14 - Accumulated Other Comprehensive Income - The changes in Accumulated other comprehensive income, net of tax were as follows: Foreign Currency Cash Not Translation Flow Investment An millions ) Adjustment Hedges Hedges! Other Total Balance at May 31, 2014 $ 9 $ 32 s $ 95 $ (51) $ S 85 Other comprehensive gains fosses) before reclassifications (20) 1,447 33 1.480 Reclassifications to net income of previously deferred (gains) losses - (259) (40) (299) Other comprehensive income foss) -20 1.188 17) 1,161 Balance at May 31, 2015 $ (11) $ 1,220 $ 95 $ (58) $ 1.246 (1) The accumulated foregn currency raration austrant and nervesbient hedge gansosses related to a rivestment in a forensesday we reclassified to Mathcome upon sale or upon comporta con todo tion of the respective only @ Nexofta benets of $0 million $3 milion milion $0 milionand millones Net of tax band of milion $2 milk Smilion $0 mibonand2 millones Foreign Currency Cash Net Translation Flow Investment On millions Adjustment Hedges Hedgesin Other Total Balance at May 31, 2013 $ 41 $ 193 $ 95 $ (55 S 274 Other comprehensive gans fosses) before reclassifications (32) (134) (166) Reclassifications to net income of previously deferred (gains) losses ) (27) - 4 (23) Other comprehensive income foss 32) (161) 4 189 Balance at May 31, 2014 $ 9 S 32 $ 95 S (51) $ 85 The accumulated foreign currency translation acustrent and not remont hale gars/osse med banana oraignesy we recessifed to Nel come upon sabor upon complete or scompte udation of the respective antity Net of tax benefit perse or omilion $9 milion milion, 50 million and $9mon respective Netotax toner) expense of smilion $9 milion Somon, smand $9 milion respecte The following table summarizes the reclassifications from Accurated other comprehensive ncome to the Consolidated Statements of income Amount of Gain (Loss) Roclassified from Accumulated Other Comprehensive Income Into Income Location of Gain (Loss) Reclassified from Accumulated Other Comprehensive Income Year Ended May 31, into Income en millions 2015 2014 Gains fosses) on cash flow hedges: Foreign exchange forwards and options $ (95) S 14 Revenues Foreign exchange forwards and options 220 12 Cost of sales Foreign exchange forwards and options Total selling and administrative expense Foreion exchange forwards and cotions 136 10 Other (income) expense.net Total before tax 261 36 Tax expense 121 101 Gain, net of tax 259 27 Gains (503) on other 40 14) Other Income expense net Total before tax 40 (4) Tax expense Gain loss), net of tax 40 10 Total net gain reclassified for the period 2995 23 OUR LOCOCO OF UZUN GO LOOD FULL VID FUSILEIS Asset Derivatives Balance Sheet Location 2015 Liability Derivatives Balance Sheet Location 2015 2014 2014 825 $ 76 Accrued abilities $ 140 S $ 57 78 Prepaid expenses and s other current assets Prepaid expenses and other current assets Deferred Income taxes and other assets Deferred income taxes and other assets 520 Anions) Derivatives formally designated as hedging instruments: Foreign exchange forwards and options Interest rate swaps Foregn exchange forwards and options Interest rate swaps Total derivatives formaly designated as hedging instruments Derivatives not designated as hedging instruments: Foreign exchange forwards and options Embedded derivatives 4 Accrued abilities 26 Deferred income taxes and other abilities 6 6 Deferred income taxes and other labilities 1,423 108 144 58 209 25 Accrued liabilities 20 27 Prepad expenses and other current assets Prepaid expenses and other current assets Deferred income taxos and other assets 2 2 Accrued abdities 5 Embedded derivatives 9 Deferred income taxes and other liabilities 216 25 31 27 Total derivatives not designated as hedging instruments TOTAL DERIVATIVES S 133 1,639 $ S 175 S 85 The following tables present the amounts affecting the Consolidated Statements of Income for years ended May 31, 2015, 2014 and 2013: Amount of Gain (Loss) Recognized in Other Amount of Gain (Loss) Comprehensive Income Reclassified From Accumulated on Derivatives Other Comprehensive Income into Income Year Ended May 31 Location of Gain (Loss) Year Ended May 31, Reclassified From Accumulated Other Ain millions 2015 2014 2013 Comprehensive Income Into Incomer 2015 2014 2013 Derivatives designated as cash flow hedges: Foreign exchange forwards and options $ (202) $ (48) $ 42 Revenues $ 95) $ 14 $ (19) Foreign exchange forwards and options 1,109 ) (78) 67 Cost of sales 220 12 113 Foreign exchange forwards and options 4 Total seling and administrative expense 2. Foreign exchange forwards and options 497 (21) 33 Other income) expense.net 136 10 9 Interest rate swaps 76 Interest expense (neome.net Total designated cash flow hedges $1,480 $(143) $ 139 $261 $ 36 $105 Derivatives designated as net investment hedges Foreign exchange forwards and options $ Other income) expense, net $ $$$ For me years anded May 31, 2015 2014 and 2013, the amounts reconocomgrense, nefas a result of badge netectveness and the disconne och tow hedges because the world besactions were no bnger probabili focurring were material Amount of Gain (Loss) Recognized in Income on Derivatives Year Ended May 31, 2015 2014 2013 Location of Gain (Loss) Recognized in Income on Derivatives $ 5 $ 5 $ 5 Interest expense (income). net Armillons Derivatives designated as fair value hedges: Interest rate swaps Derivatives not designated as hedging instruments: Foreign exchange forwards and options Embedded derivatives 611 $ (US ( (75) $ OS 51 4 Other (income) expense, net Other (income) expense, net S Anterest rate was designated as far vale edgesmee me shortcut method requerents under the accounting standarts border Wahes and hedon. According anges in the burvals of the newest was consided locally off changes in the frame of the un