

Answered step by step
Verified Expert Solution
Question
1 Approved Answer
10:16 AM Sun Jan 29 < +: Lab #1 Data and Literature Pre-Laboratory Assignment Complete the following pre-laboratory questions and upload to Blackboard 1.
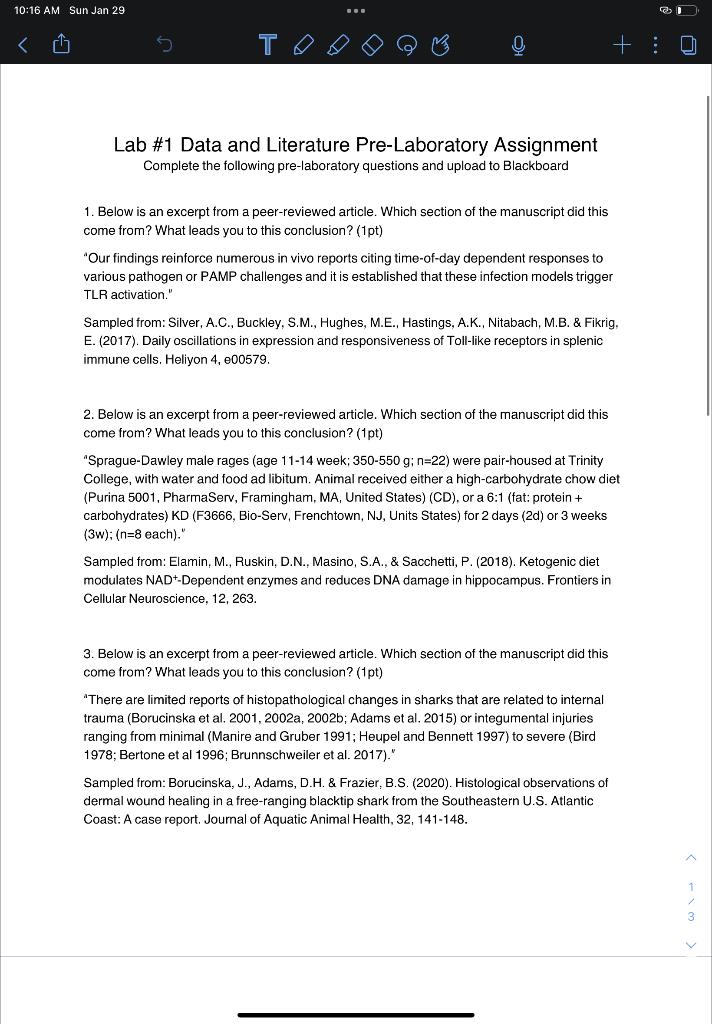
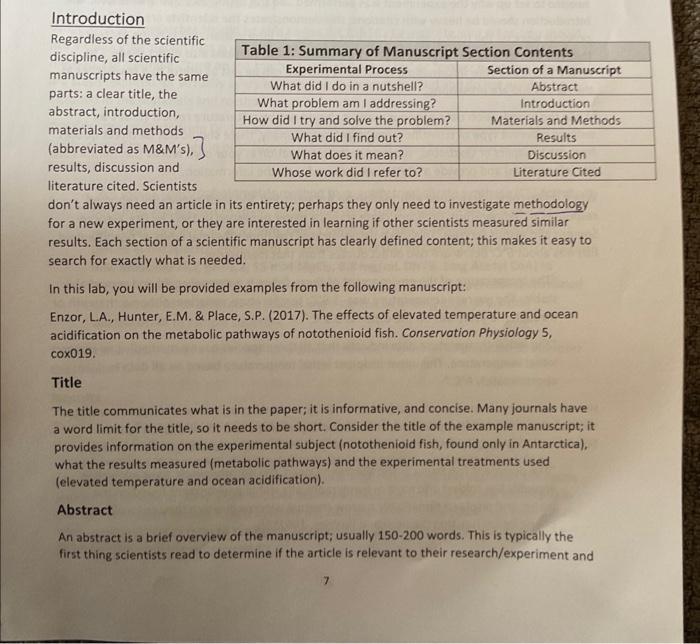
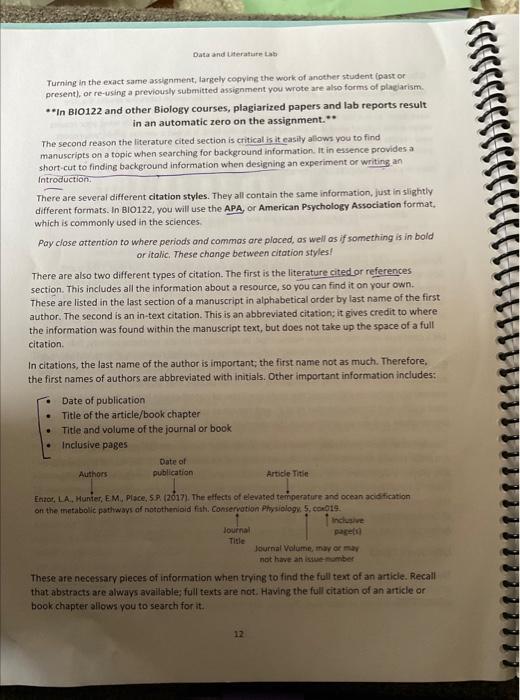
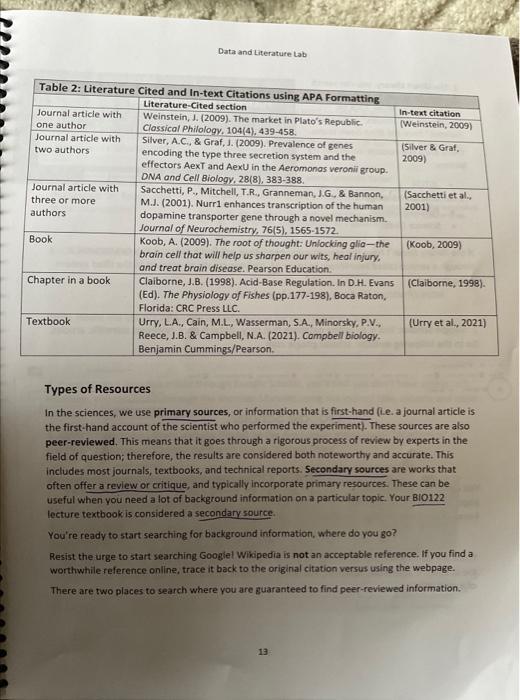
10:16 AM Sun Jan 29 < +: Lab #1 Data and Literature Pre-Laboratory Assignment Complete the following pre-laboratory questions and upload to Blackboard 1. Below is an excerpt from a peer-reviewed article. Which section of the manuscript did this come from? What leads you to this conclusion? (1pt) "Our findings reinforce numerous in vivo reports citing time-of-day dependent responses to various pathogen or PAMP challenges and it is established that these infection models trigger TLR activation." Sampled from: Silver, A.C., Buckley, S.M., Hughes, M.E., Hastings, A.K., Nitabach, M.B. & Fikrig, E. (2017). Daily oscillations in expression and responsiveness of Toll-like receptors in splenic immune cells. Heliyon 4, e00579. 2. Below is an excerpt from a peer-reviewed article. Which section of the manuscript did this come from? What leads you to this conclusion? (1pt) "Sprague-Dawley male rages (age 11-14 week; 350-550 g; n=22) were pair-housed at Trinity College, with water and food ad libitum. Animal received either a high-carbohydrate chow diet (Purina 5001, PharmaServ, Framingham, MA, United States) (CD), or a 6:1 (fat: protein + carbohydrates) KD (F3666, Bio-Serv, Frenchtown, NJ, Units States) for 2 days (2d) or 3 weeks (3w); (n=8 each)." Sampled from: Elamin, M., Ruskin, D.N., Masino, S.A., & Sacchetti, P. (2018). Ketogenic diet modulates NAD+-Dependent enzymes and reduces DNA damage in hippocampus. Frontiers in Cellular Neuroscience, 12, 263. 3. Below is an excerpt from a peer-reviewed article. Which section of the manuscript did this come from? What leads you to this conclusion? (1pt) "There are limited reports of histopathological changes in sharks that are related to internal trauma (Borucinska et al. 2001, 2002a, 2002b; Adams et al. 2015) or integumental injuries ranging from minimal (Manire and Gruber 1991; Heupel and Bennett 1997) to severe (Bird 1978; Bertone et al 1996; Brunnschweiler et al. 2017)." Sampled from: Borucinska, J., Adams, D.H. & Frazier, B.S. (2020). Histological observations of dermal wound healing in a free-ranging blacktip shark from the Southeastern U.S. Atlantic Coast: A case report. Journal of Aquatic Animal Health, 32, 141-148. 1 Introduction Regardless of the scientific discipline, all scientific manuscripts have the same parts: a clear title, the abstract, introduction, materials and methods (abbreviated as M&M's), results, discussion and literature cited. Scientists Table 1: Summary of Manuscript Section Contents Experimental Process What did I do in a nutshell? What problem am I addressing? How did I try and solve the problem? What did I find out? What does it mean? Whose work did I refer to? Section of a Manuscript Abstract Introduction Materials and Methods Results Discussion Literature Cited don't always need an article in its entirety; perhaps they only need to investigate methodology for a new experiment, or they are interested in learning if other scientists measured similar results. Each section of a scientific manuscript has clearly defined content; this makes it easy to search for exactly what is needed. In this lab, you will be provided examples from the following manuscript: Enzor, L.A., Hunter, E.M. & Place, S.P. (2017). The effects of elevated temperature and ocean acidification on the metabolic pathways of notothenioid fish. Conservation Physiology 5, cox019. Title The title communicates what is in the paper; it is informative, and concise. Many journals have a word limit for the title, so it needs to be short. Consider the title of the example manuscript; it provides information on the experimental subject (notothenioid fish, found only in Antarctica), what the results measured (metabolic pathways) and the experimental treatments used (elevated temperature and ocean acidification). Abstract An abstract is a brief overview of the manuscript; usually 150-200 words. This is typically the first thing scientists read to determine if the article is relevant to their research/experiment and Data and Literature Lab Turning in the exact same assignment, largely copying the work of another student (past or present), or re-using a previously submitted assignment you wrote are also forms of plagiarism. In BIO122 and other Biology courses, plagiarized papers and lab reports result in an automatic zero on the assignment.** The second reason the literature cited section is critical is it easily allows you to find manuscripts on a topic when searching for background information. It in essence provides a short-cut to finding background information when designing an experiment or writing an Introduction. There are several different citation styles. They all contain the same information, just in slightly different formats. In BIO122, you will use the APA, or American Psychology Association format, which is commonly used in the sciences. Pay close attention to where periods and commas are placed, as well as if something is in bold or italic. These change between citation styles! There are also two different types of citation. The first is the literature cited or references section. This includes all the information about a resource, so you can find it on your own. These are listed in the last section of a manuscript in alphabetical order by last name of the first author. The second is an in-text citation. This is an abbreviated citation; it gives credit to where the information was found within the manuscript text, but does not take up the space of a full citation. In citations, the last name of the author is important; the first name not as much. Therefore, the first names of authors are abbreviated with initials. Other important information includes: Date of publication Title of the article/book chapter Title and volume of the journal or book Inclusive pages Authors Date of publication Article Title Enzor, LA, Hunter, E.M., Place, S.P. (2017). The effects of elevated temperature and ocean acidification on the metabolic pathways of notothenioid fish. Conservation Physiology. 5, cox019. Journal Inclusive page(s) Title Journal Volume, may or may not have an issue number These are necessary pieces of information when trying to find the full text of an article. Recall that abstracts are always available; full texts are not. Having the full citation of an article or book chapter allows you to search for it.. 12 Data and Literature Lab Table 2: Literature Cited and In-text Citations using APA Formatting Journal article with one author Journal article with two authors Journal article with three or more authors Book Chapter in a book Literature-Cited section Weinstein, J. (2009). The market in Plato's Republic. Classical Philology, 104(4), 439-458 Silver, A.C., & Graf, J. (2009). Prevalence of genes encoding the type three secretion system and the effectors AexT and AexU in the Aeromonas veronii group. DNA and Cell Biology, 28(8), 383-388. Sacchetti, P., Mitchell, T.R., Granneman, J.G., & Bannon, M.J. (2001). Nurr1 enhances transcription of the human dopamine transporter gene through a novel mechanism. Journal of Neurochemistry, 76(5), 1565-1572. Koob, A. (2009). The root of thought: Unlocking glia-the brain cell that will help us sharpen our wits, heal injury, and treat brain disease. Pearson Education. In-text citation (Weinstein, 2009) (Silver & Graf, 2009) (Sacchetti et al., 2001) (Koob, 2009) Claiborne, J.B. (1998). Acid-Base Regulation. In D.H. Evans (Claiborne, 1998). (Ed). The Physiology of Fishes (pp.177-198), Boca Raton, Florida: CRC Press LLC. Textbook Urry, L.A., Cain, M.L., Wasserman, S.A., Minorsky, P.V., Reece, J.B. & Campbell, N.A. (2021). Campbell biology. Benjamin Cummings/Pearson. (Urry et al., 2021) Types of Resources In the sciences, we use primary sources, or information that is first-hand (ie. a journal article is the first-hand account of the scientist who performed the experiment). These sources are also peer-reviewed. This means that it goes through a rigorous process of review by experts in the field of question; therefore, the results are considered both noteworthy and accurate. This includes most journals, textbooks, and technical reports. Secondary sources are works that often offer a review or critique, and typically incorporate primary resources. These can be useful when you need a lot of background information on a particular topic. Your BIO122 lecture textbook is considered a secondary source. You're ready to start searching for background information, where do you go? Resist the urge to start searching Google! Wikipedia is not an acceptable reference. If you find a worthwhile reference online, trace it back to the original citation versus using the webpage. There are two places to search where you are guaranteed to find peer-reviewed information. 13
Step by Step Solution
There are 3 Steps involved in it
Step: 1
The question and the initial answer provided do not match the context of the provided images which are describing a Lab 1 Data and Literature PreLaboratory Assignment related to scientific literature ...
Get Instant Access to Expert-Tailored Solutions
See step-by-step solutions with expert insights and AI powered tools for academic success
Step: 2

Step: 3
Ace Your Homework with AI
Get the answers you need in no time with our AI-driven, step-by-step assistance
Get Started
Accounting
Authors: Carl s. warren, James m. reeve, Philip e. fess
21st Edition
978-0324400205, 324225016, 324188005, 324400209, 9780324225013, 978-0324188004